
Creating Alerts
Security Requirements and Controls
Change triggers and actionspermission
Alerts are constructed using queries and associated with one or more actions that will be triggered when then query runs. When creating an alert, the type of alert must be selected and this will adjust which configuration operations are available, which is summarized in this table:
| Configuration | Standard Alert | Filter Alert |
|---|---|---|
| General Parameters | Standard alert option in General | Filter Alert option in General |
| Query | Yes, supporting aggregates and joins | Yes, aggregates and joins are not supported |
| Actions | Yes | Yes |
| Throttling | Supported, see Setting Alert Throttle Period | Supported from version 1.129, see Setting Alert Throttle Period |
| Action Retries | Yes, for a single action; when multiple actions are configured, no retry is performed if at least one action is successfully invoked. | Yes, for a single action; when multiple actions are configured, no retry is performed if at least one action is successfully invoked. |
To create a new alert:
Go to the Repositories and Views page.
Select a Repository or View.
Click the tab on the top bar of the User Interface and select from the menu on the left: the full list of available alerts appears. They can have labels attached to them which are displayed next to the alert name. This can be a useful way to tag the alerts with meaningful data and to help when trying to locate them with a certain tag.
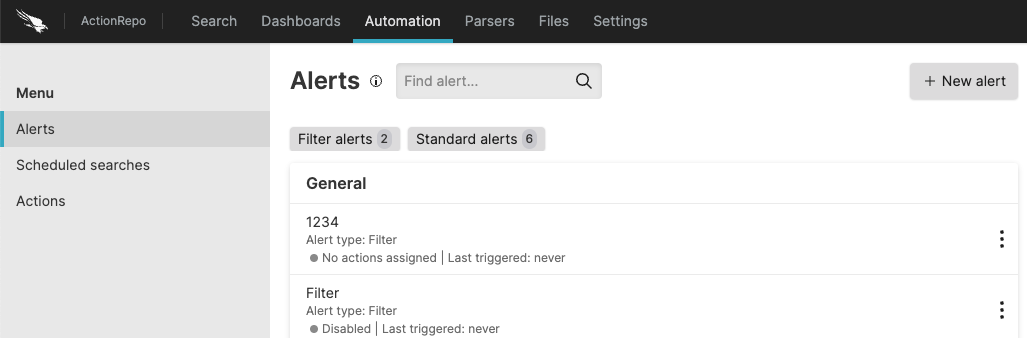
Figure 176. Creating Alert from Tab
Click
The New alert form is displayed, click on the top right if you wish to import the alert from:
, browse for or drag and drop a template based on an existing alert
, invoke alert templates that are part of a LogScale package
Fill in the form with the information required:
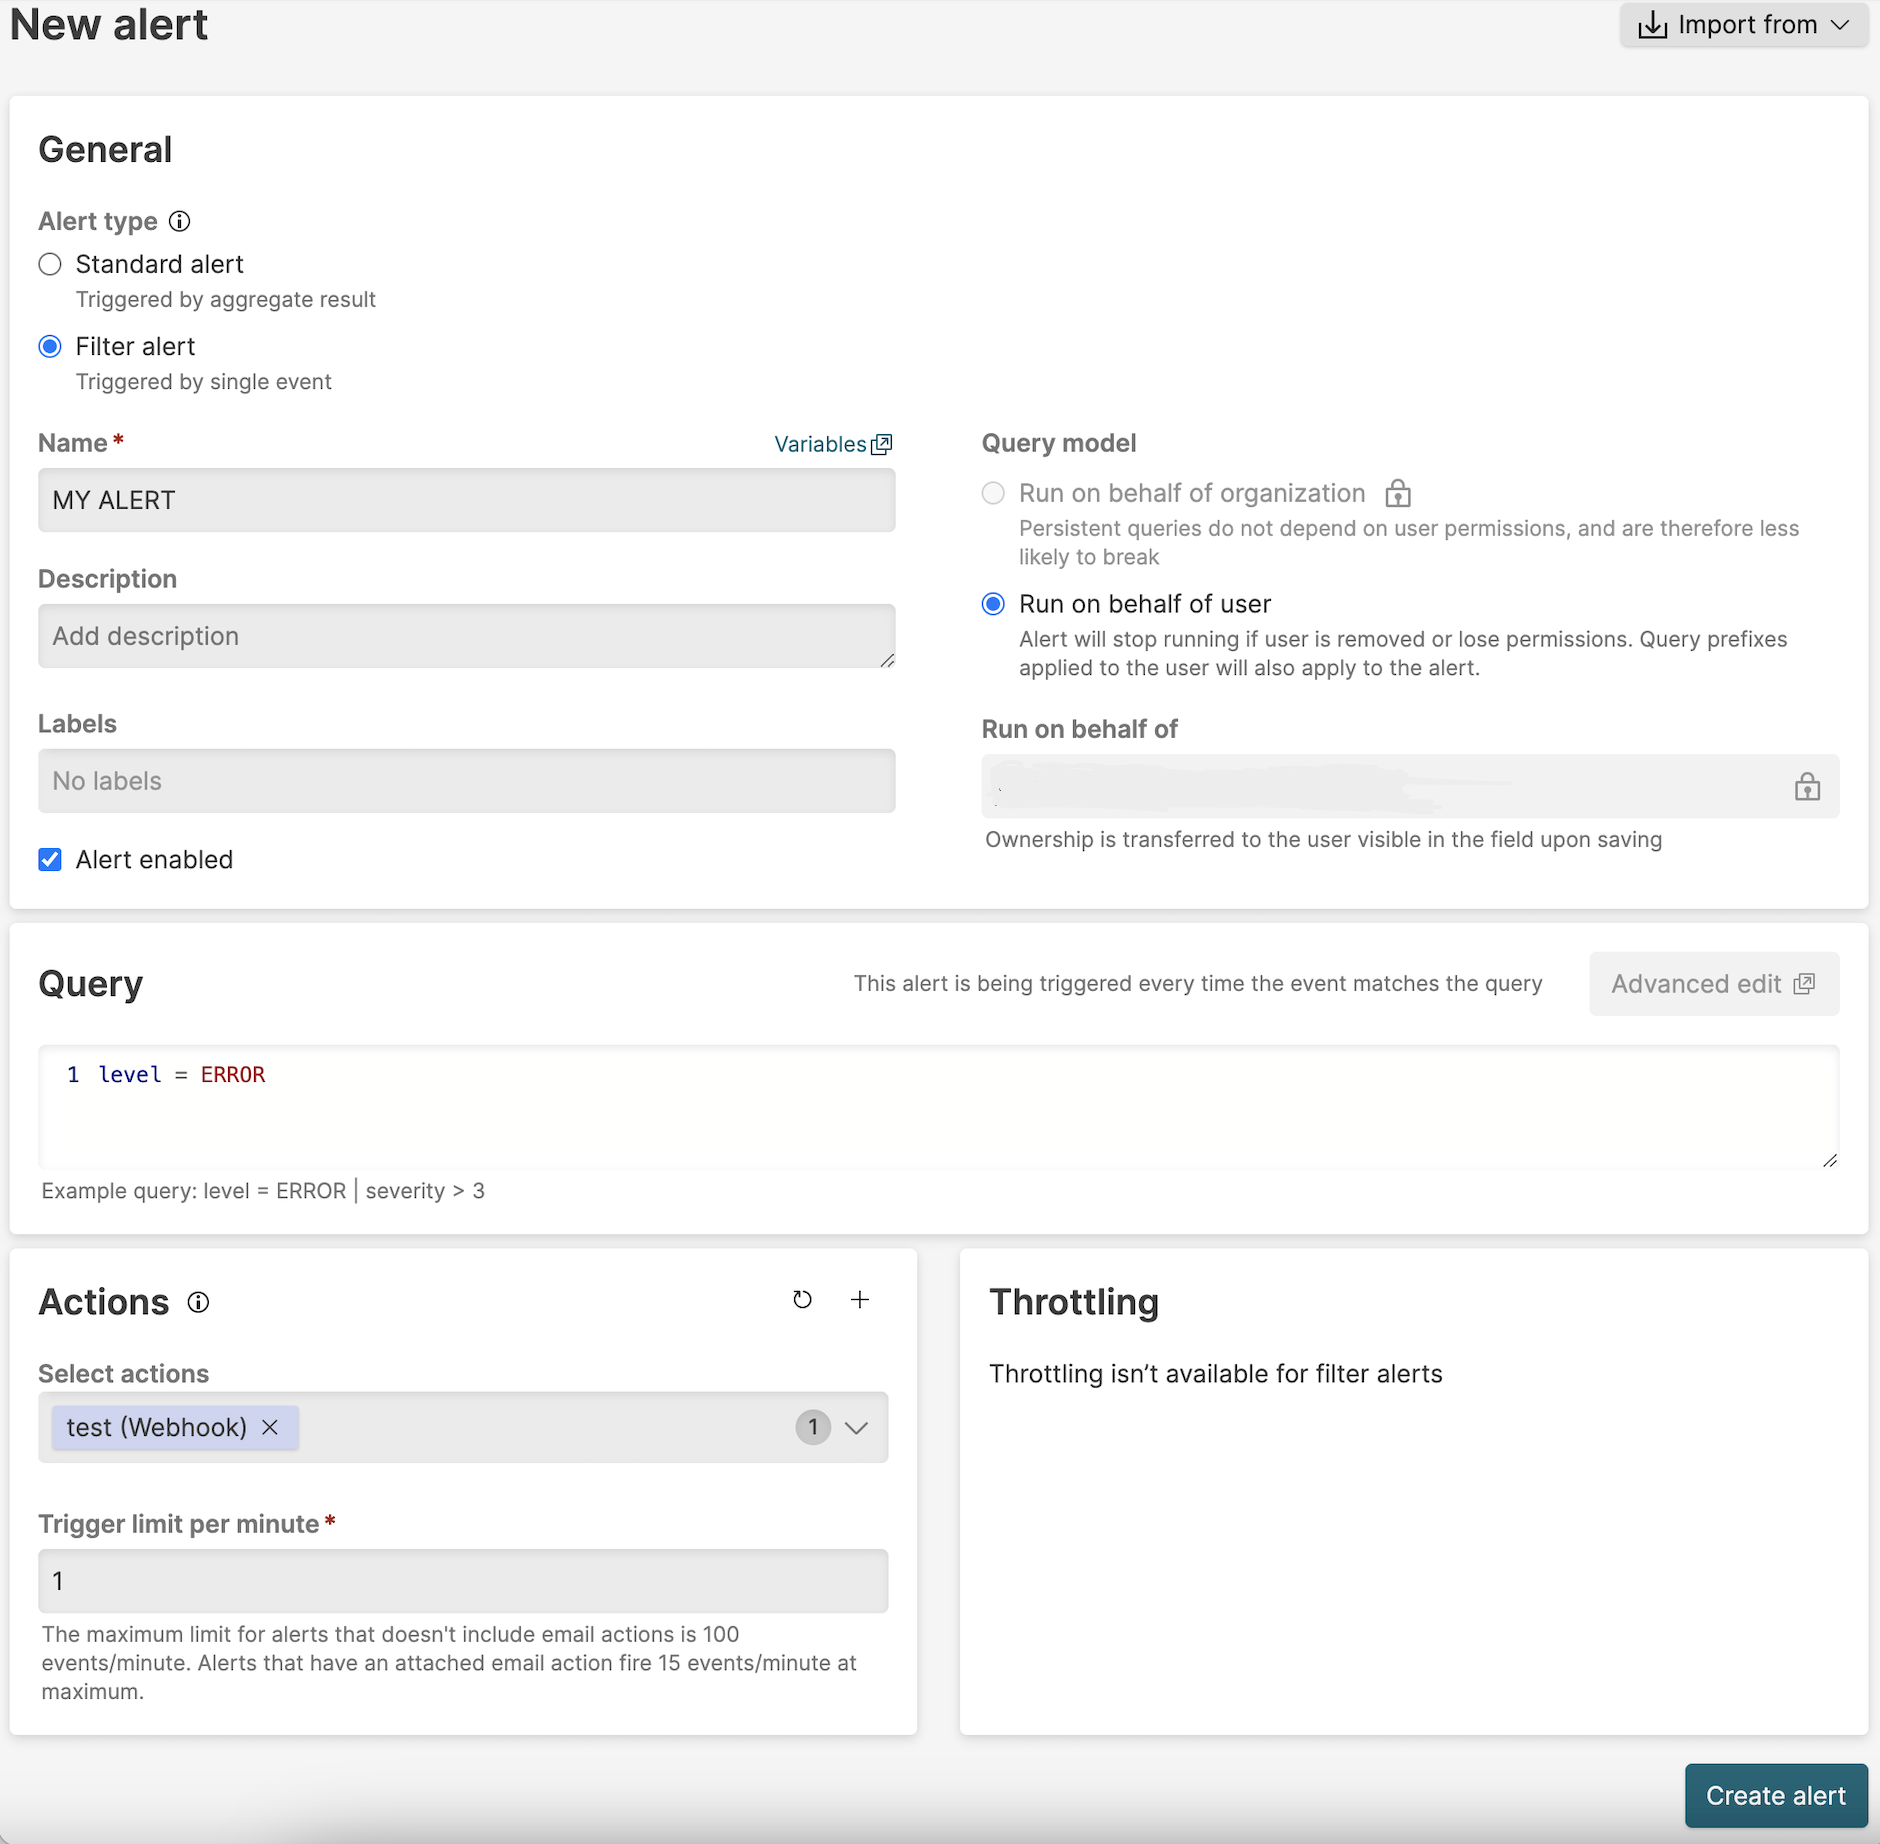
Figure 177. Creating an Alert
General
Select the Alert type:
A Standard alert is triggered by the results of a query and supports aggregate query results
A Filter alert is triggered by a single event.
For more information on the differences, see Alerts
You may change the Name and enter a Description that can be used to describe more specifically what causes the alert to be triggered.
You can categorize alerts using Labels. Existing labels are presented as a list of checkboxes, or you can enter a new label and create and select it. These can be used within the UI to filter alerts. See Managing Alerts for more information.
New alerts are automatically enabled. To change this, click the Alert enabled checkbox. Disabled alerts do not execute the corresponding query or trigger actions.
You can use the Run on behalf of field to run the alert on behalf of another user i.e. using their permissions; click this field to get a list of available names to pick from, or directly enter the name of the user you want to run the alert as. You can see and edit this field if you have
ChangeTriggersToRunAsOtherUsers,ManageOrganizations, orrootsystem permissions.
Query — Type the query that generates the alert and specify the desired time window. The minimum time window allowed for the query is and the minimum allowed unit to express it is .
In the example query shown in Figure 177, “Creating an Alert” we're searching for events in which the web server recorded a log level equal to ERROR.
Actions — you may want to add an action for LogScale to take when the alert is triggered, if you have one that's suitable for this alert.
See Actions for more information.
An alert will not be executed until there is at least one configured action.
To delete an existing action, click the next to each action.
Throttling — enables how often an alert is triggered to be set. For more information on configuring throttling, see Setting Alert Throttle Period.
Until version 1.128, throttling is only available for Standard Alerts. From version 1.129, it is also available for Filter Alerts.
When you're done setting the properties for the new alert, click .
Note
Once the alert is saved, the query window is automatically changed to the largest unit in the Relative Time Syntax that can represent it. For example
24his changed to1dand60sis changed to1m.
Creating an Alert from a Query
You can convert a query you've just typed to a new alert:
Go to the tab on the top bar of the User Interface.
Type the query you need for your alert.
In the example query shown in Figure 178, “Creating Alert from Query” we're counting events in which the web server recorded a given number of warnings in the warningCode field.
Notice that the time period for the query is set to a live, continuous data range — not static data. You don't need a query to alert you to something that already happened when you created the alert. You generally need to be alerted about events that happen afterwards.
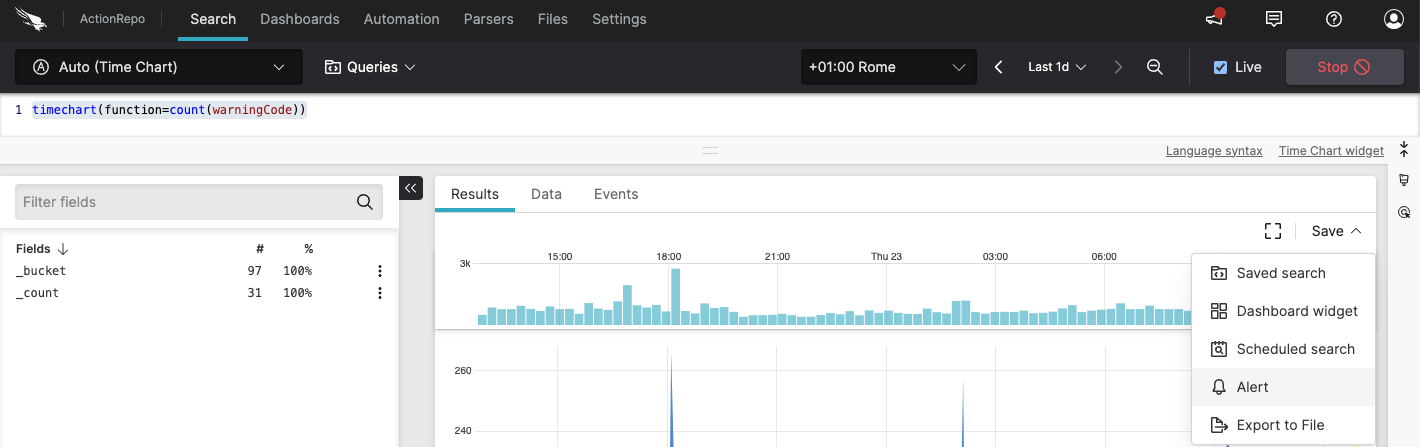
Figure 178. Creating Alert from Query
Click near the top right and choose the option.
Provide the information required in the Save as alert page. The alert type will be automatically determined based on a query detection — if the query contains an aggregate query function such as
count(), the Standard Alert type is automatically selected, with a message explaining why: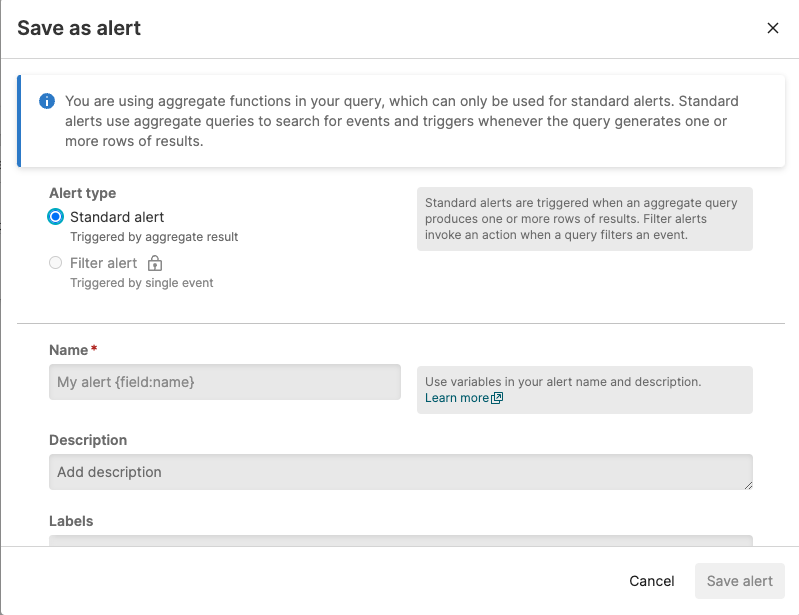
Figure 179. Automatic alert type selection
If instead a filter query is typed in the Query Editor, the Filter Alert type is selected, with a message that describes why it is recommended.
When you've finished setting the properties for the new alert, click .