Widgets
Security Requirements and Controls
Change dashboardspermission
Widgets are the main elements of dashboards in the User Interface. Think of them as ways of showing data in different forms, customized according to your needs to get results that would offer meaningful sights of your data.
For example, you may want to:
Monitor server activities by seeing the data progress in a live chart
Collect the results as listed in a table
Simply count the occurrences of an event
You can achieve all this by creating and modifying various types of widget — go to Manage Widgets page for instructions on how to do it.
A variety of different widgets are available to display information in different formats:
The list below introduces all the available widgets — click on the names for more information about a particular widget, such as examples of queries that can be used along with that widget, input formats, or a description of its properties.
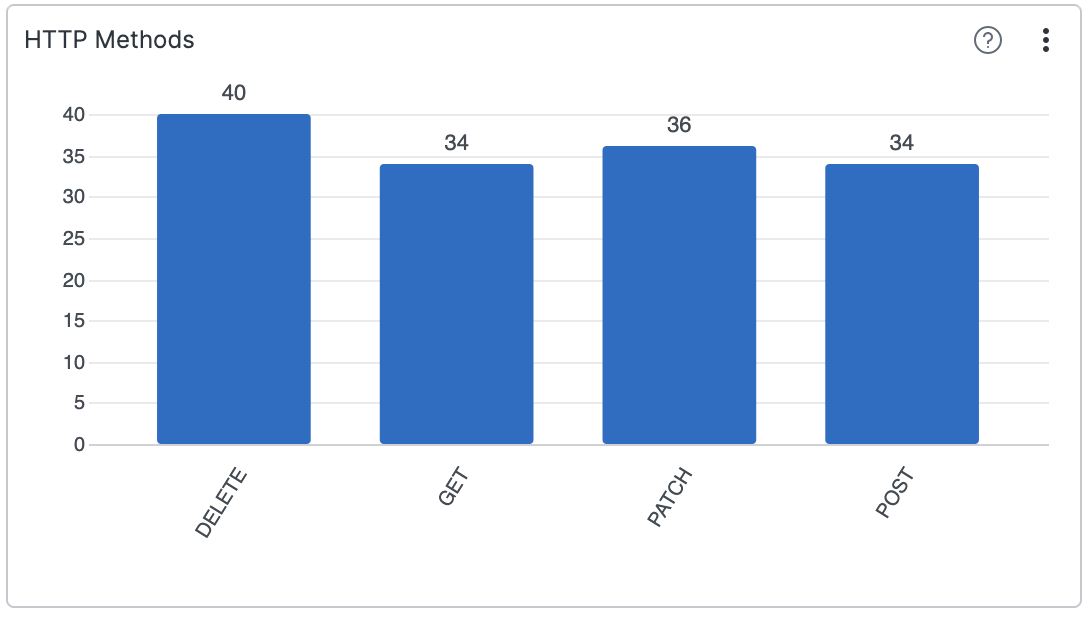
Visualizes results of the aggregated data — even the results with multiple aggregates.
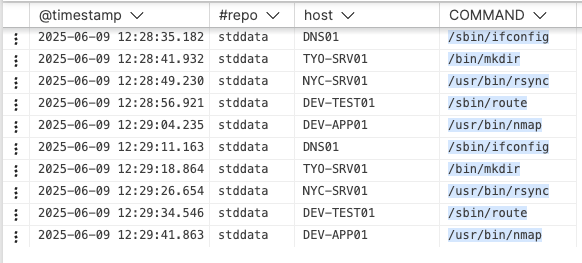
Displays data entries coming into LogScale. It's the default way to view data.
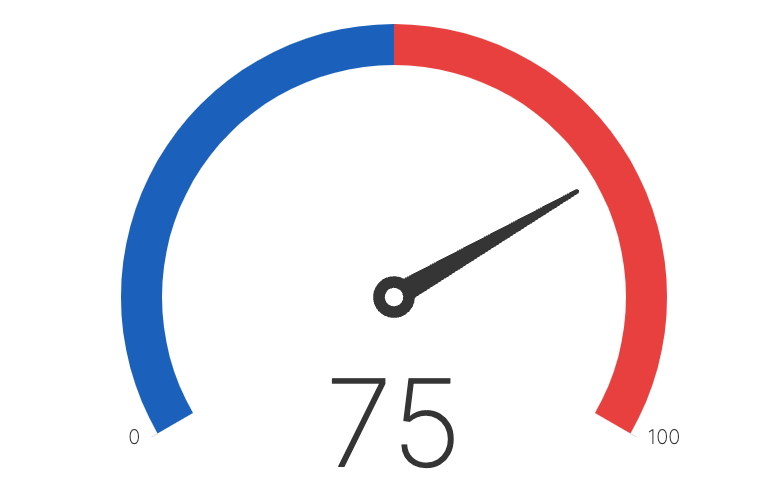
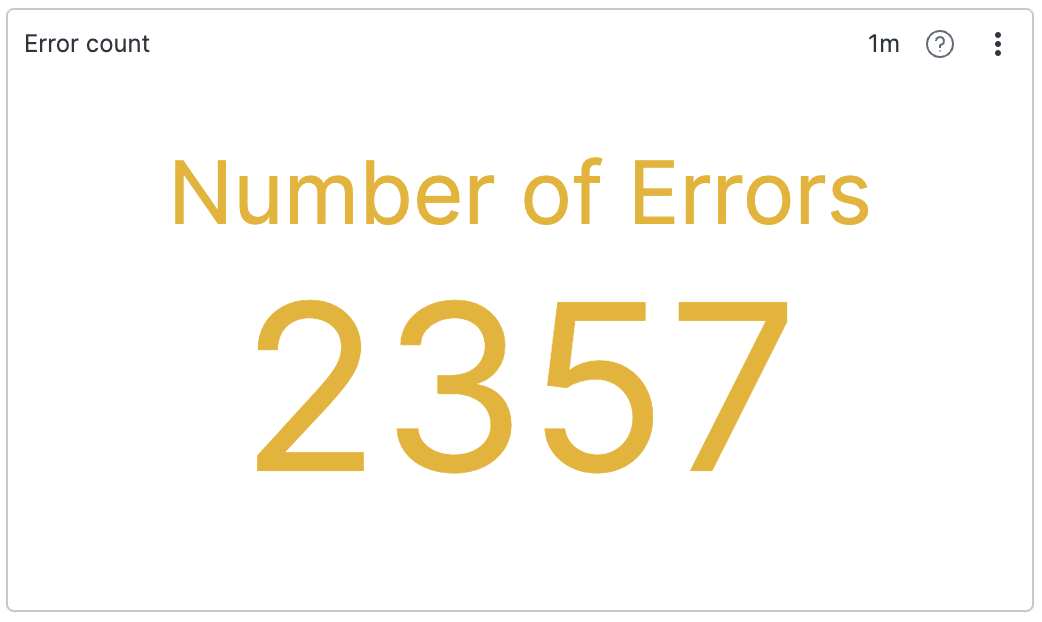
Displays a single number, a total for a search result (for instance, number of errors for day).
Also supports multiple small charts — one for each field value of the aggregate query.
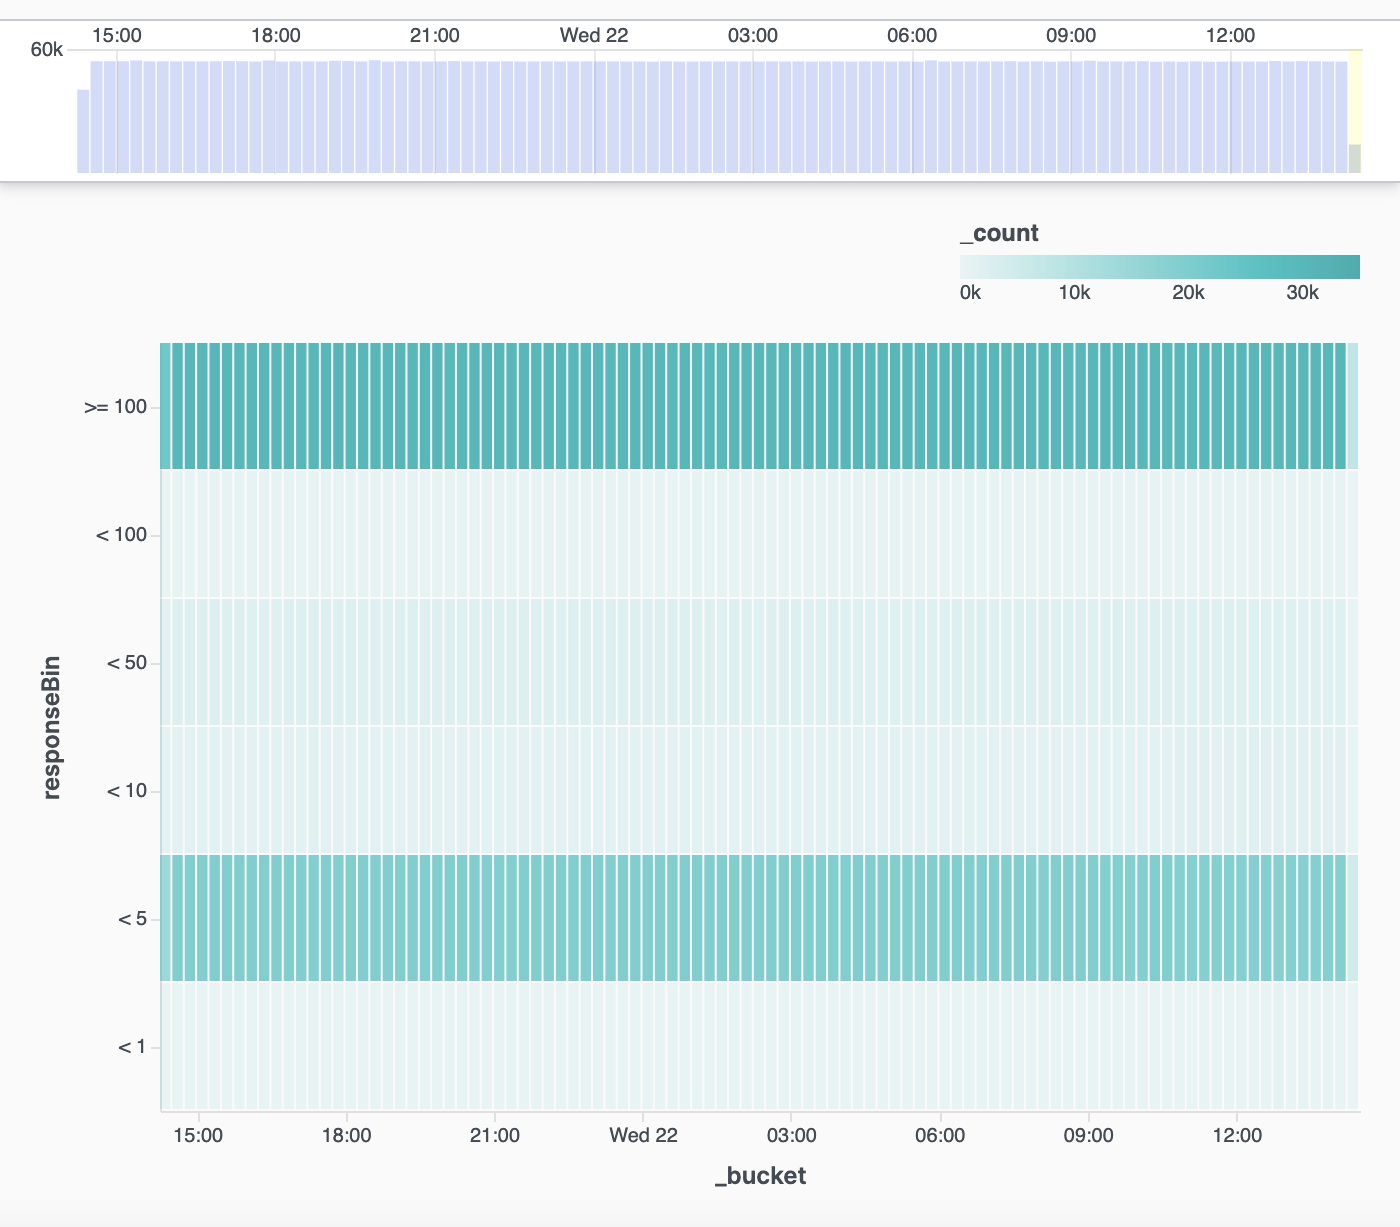
Displays a central variable of interest across two-axis variables.
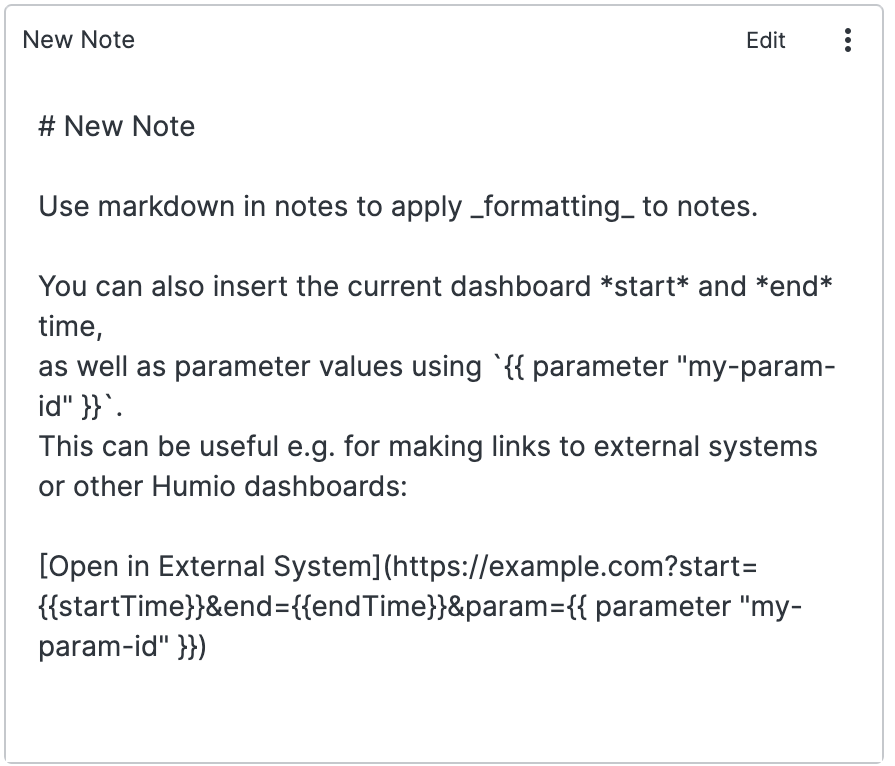
Can contain usage descriptions, user guides and dynamic links to other systems.
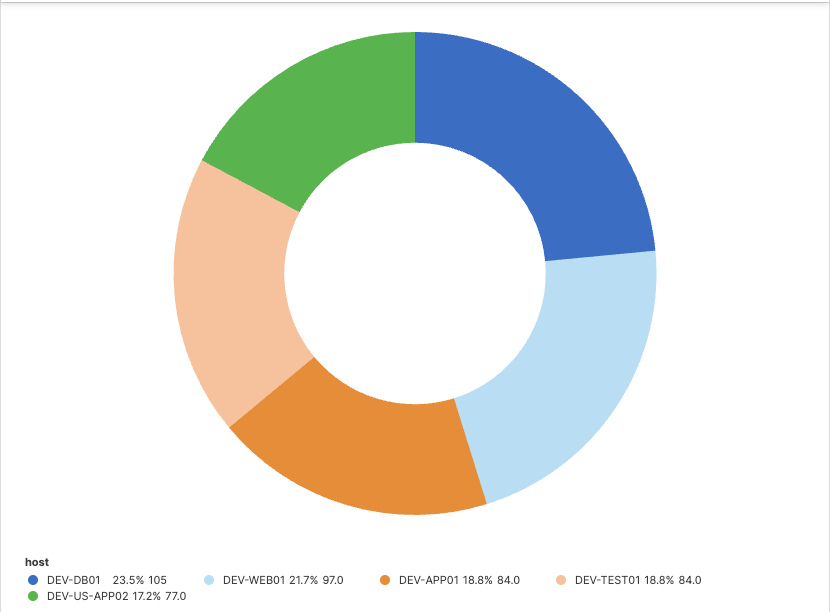
Views aggregated data, similar to the Bar Chart Widget and shows a visual image of the data as a whole, and proportionally for each component.
When used with aggregate queries that have more than one field, also supports multiple small charts — one for each field value.
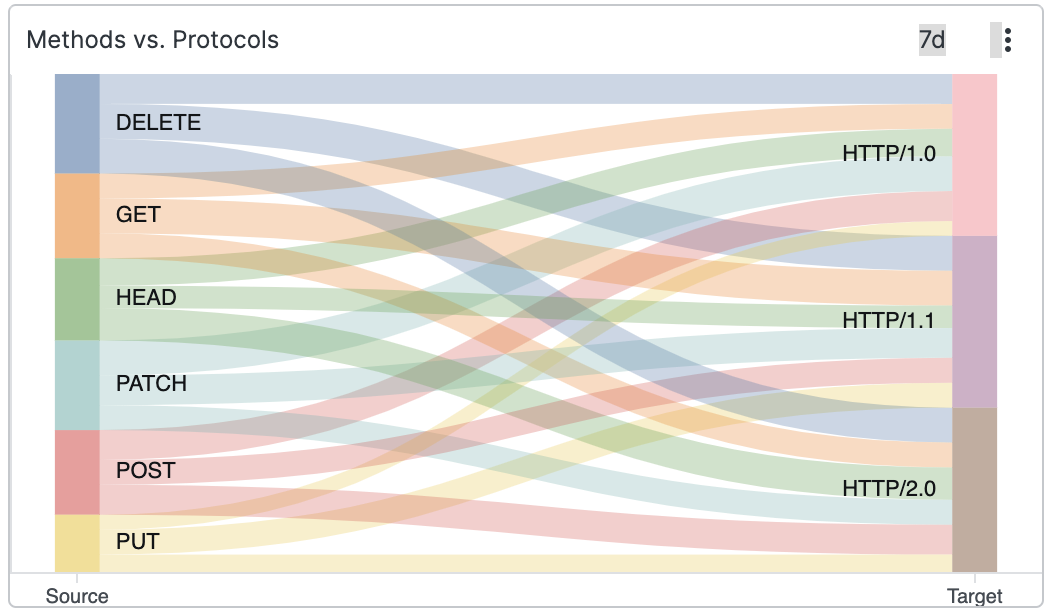
Shows results as a two-level Sankey diagram.
Displays a single value as the outcome of a search result, can be a number or a non-numeric value.
Also supports small multiple charts — one for each field value of the aggregate query.
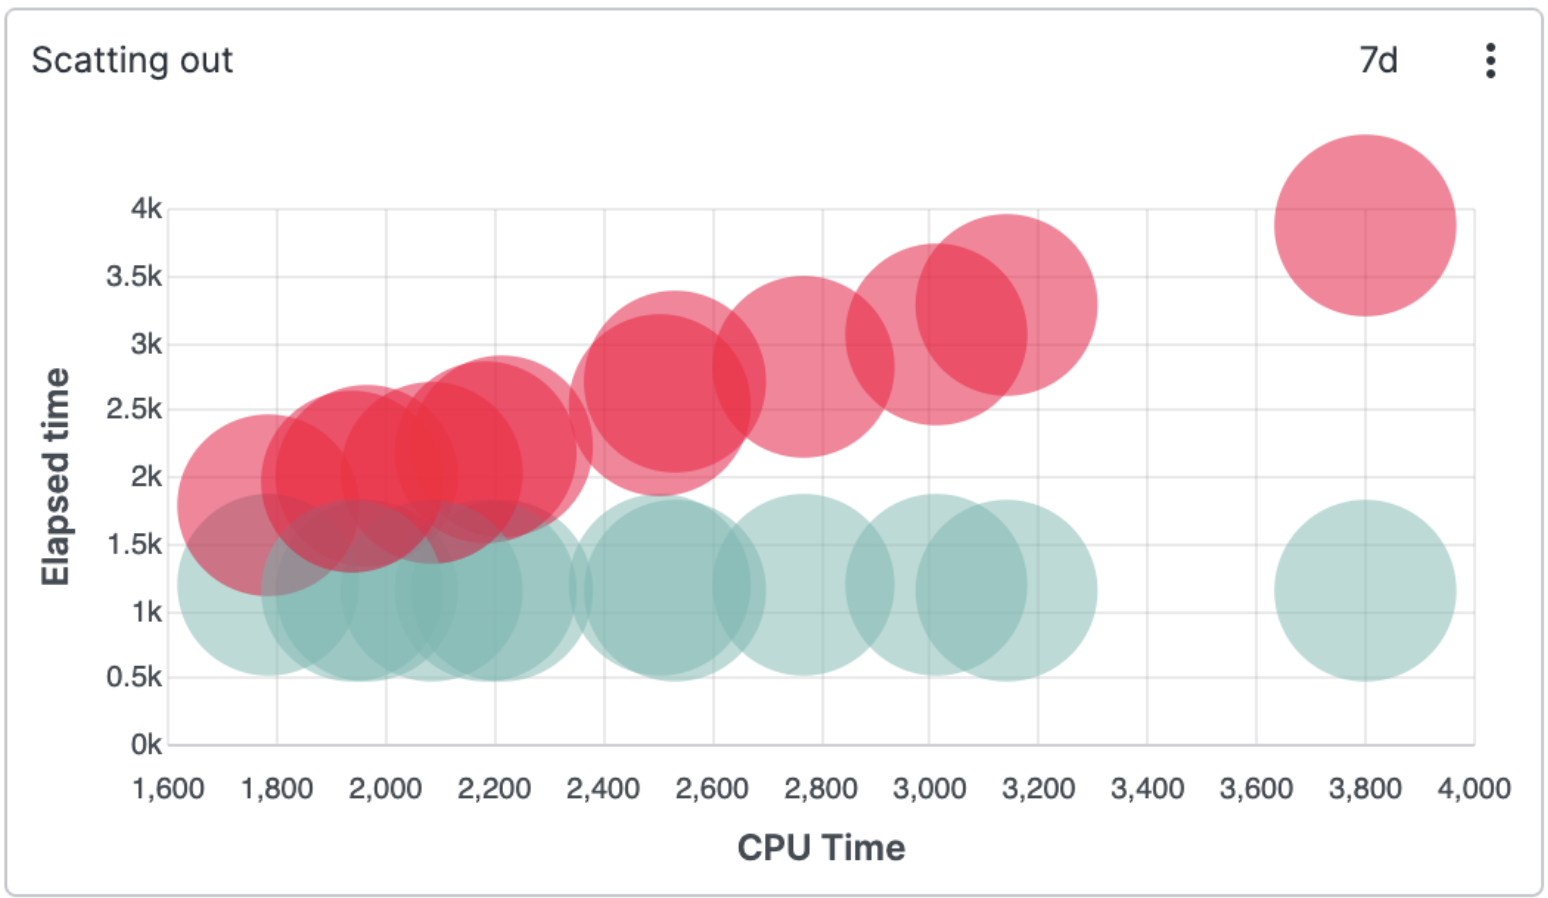
Correlates two or more sets of different numerical values.
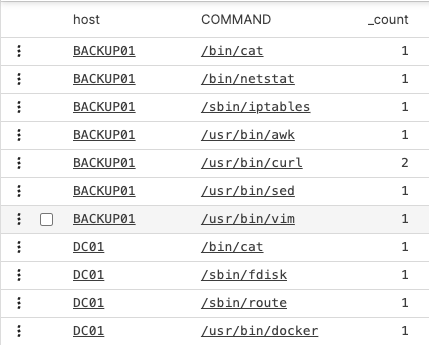
Shows the results of a search in a list with labels or field names and values for each.
Displays time series data on a timeline. Used most frequently, working with this widget is a good skill to master when first using LogScale.
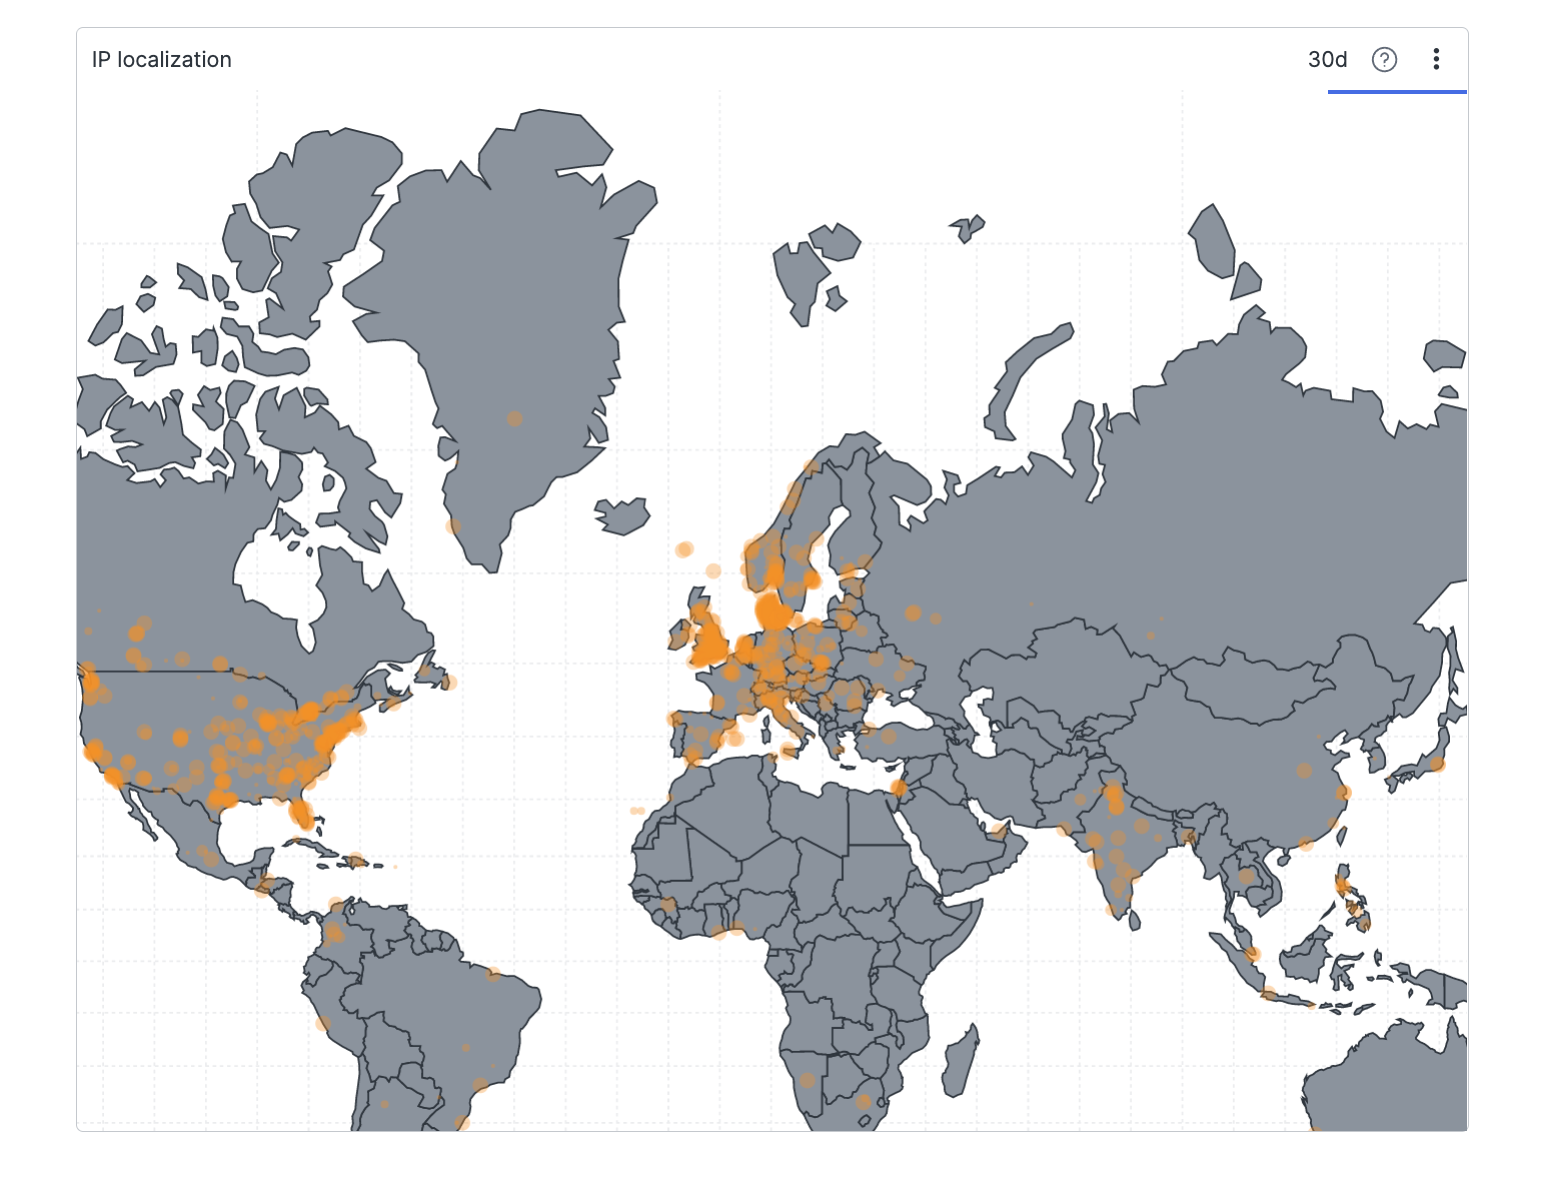
Displays a map of the world indicating values for each location.
