
Event List Widget
The Event List widget is the main way of exploring events in LogScale, as it displays events as they are ingested into LogScale, and is the default visualization on the Search UI page for events.
Think of an event as a line from a log file: you can select a portion of lines from a given search interval to be viewed in the widget, as shown in Figure 164, “Event List”.
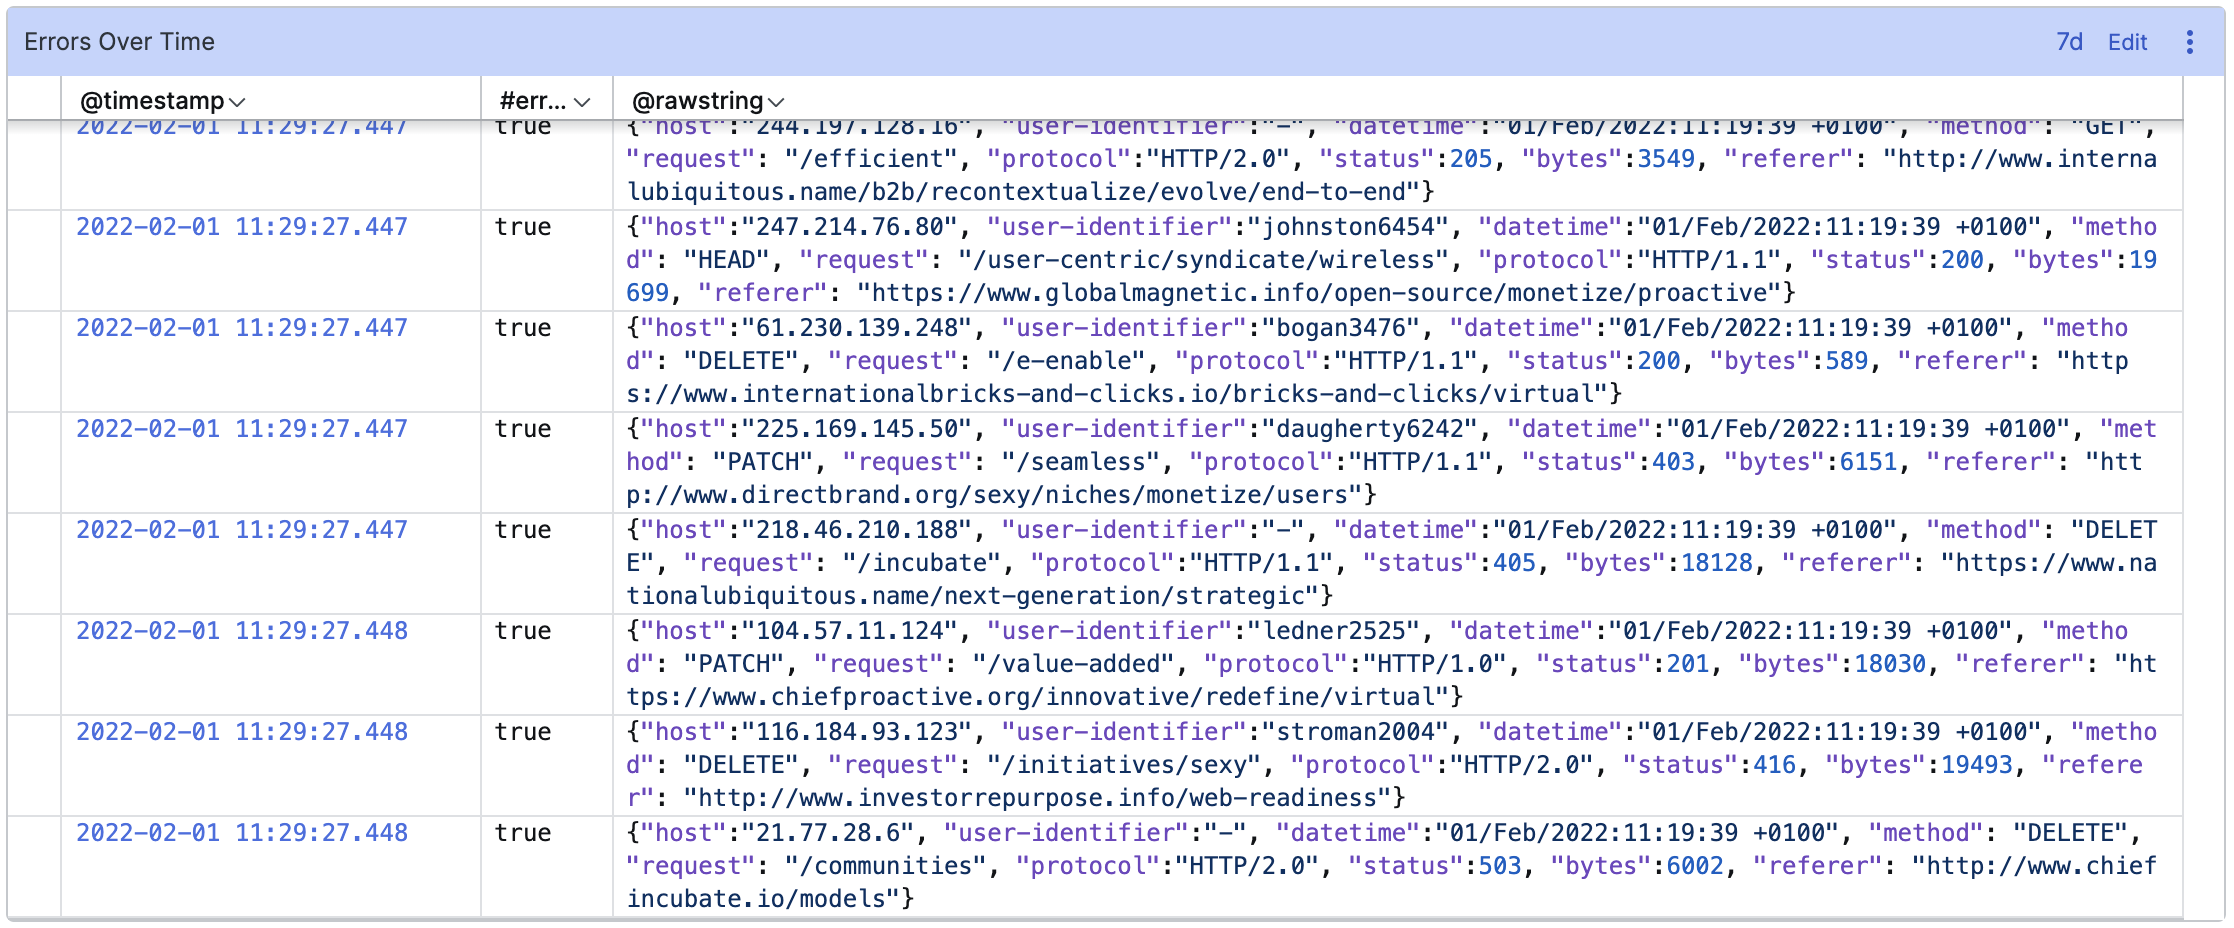 |
Figure 164. Event List
Input Format
The table below describes the main columns that are typically displayed in the Event List.
@timestamp and @rawstring columns are displayed by default in a given format. For example, @rawstring is displayed as Log line format. However, the formatting for fields in the Event List can be changed, see Field Data Types for more information.
| Field | Type | Description |
|---|---|---|
| @id | string | Meta field automatically generated by LogScale for all events. |
| @timestamp | datetime | The timestamp of the events is used to order events in the list. |
| @rawstring | string | The content of the line. Usually this value is automatically assigned during parsing. |
Event List will list as many
results as returned by the LogScale server, which defaults to the
200 most recent events of the
search interval. You can increase this by using the
tail() function, for example
tail(1000), but this can cause
performance issues in the UI if too many elements are rendered.
Widget Properties
In the widget's side panel (Figure 123, “Widget Menu”), click the icon to configure the following properties. panel:
Title
The title of the widget as displayed in the dashboard. As in the example Figure 164, “Event List”, it could be Errors Over Time.
Description
The description of the chart. This is free form text supporting markdown syntax.
This same description appears in the dashboard as a tool-tip when hovering over the question mark on top of the widget.
Default time
The default current time selection defined at section or widget level within the dashboard.
Time selector arrows
Click to enter a customized jump size (in milliseconds) to use when moving the interval earlier or later in time in the widget time selector.
In the widget side panel (Figure 123, “Widget Menu”), click the brush icon to configure the following properties.
Column properties
Allows configuring the properties of the selected column, as described in Column Properties.
Size
Allows adjusting the width of the selected column (fit to content, fit to event list, custom).
ANSI Code Support
Attention
Feature Availability
ANSI escaping of results is only available for Self-Hosted
customers, controlled by the ReplaceANSIEscapeCodes
dynamic configuration variable.
In Cloud environments, ANSI code support has been removed starting from version 1.112.1. See Troubleshooting: ANSI Escape Codes Trigger a Warning for more information.
The Event List widget supports ANSI
codes for colour markup and text formatting. To use ANSI codes, you
must escape the ANSI markup using the hexadecimal character, either
\x1B or \u0018.
The ANSI markup only works for unstructured text within the
Event List, whether in the search or a
dashboard. You cannot use ANSI markup within titles or other text, and
ANSI codes are not interpreted for XML or JSON formatted data.
For example, setting the @rawstring to add a colorized element:
@rawstring:="Colorizing \x1B[31m some \u001B[0m text"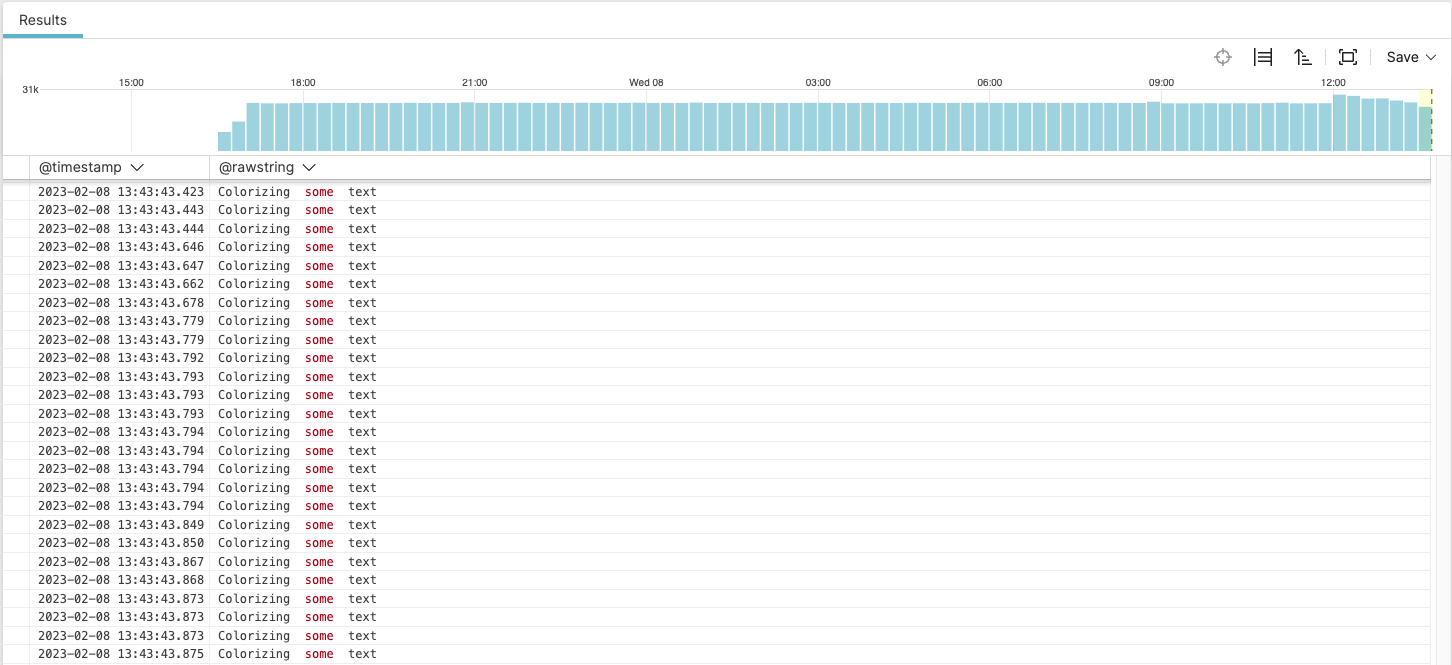 |
Figure 165. ANSI Parsing in the Event List Widget