
DR Failover
The steps described in the following sections are performed when a disaster scenario occurs, such as when a node pool becomes unavailable or the entire Azure region becomes inaccessible. Execute these steps when the primary cluster is unreachable and you need to activate the secondary cluster to restore service.
Stage 1: DR Provisioning Architecture:
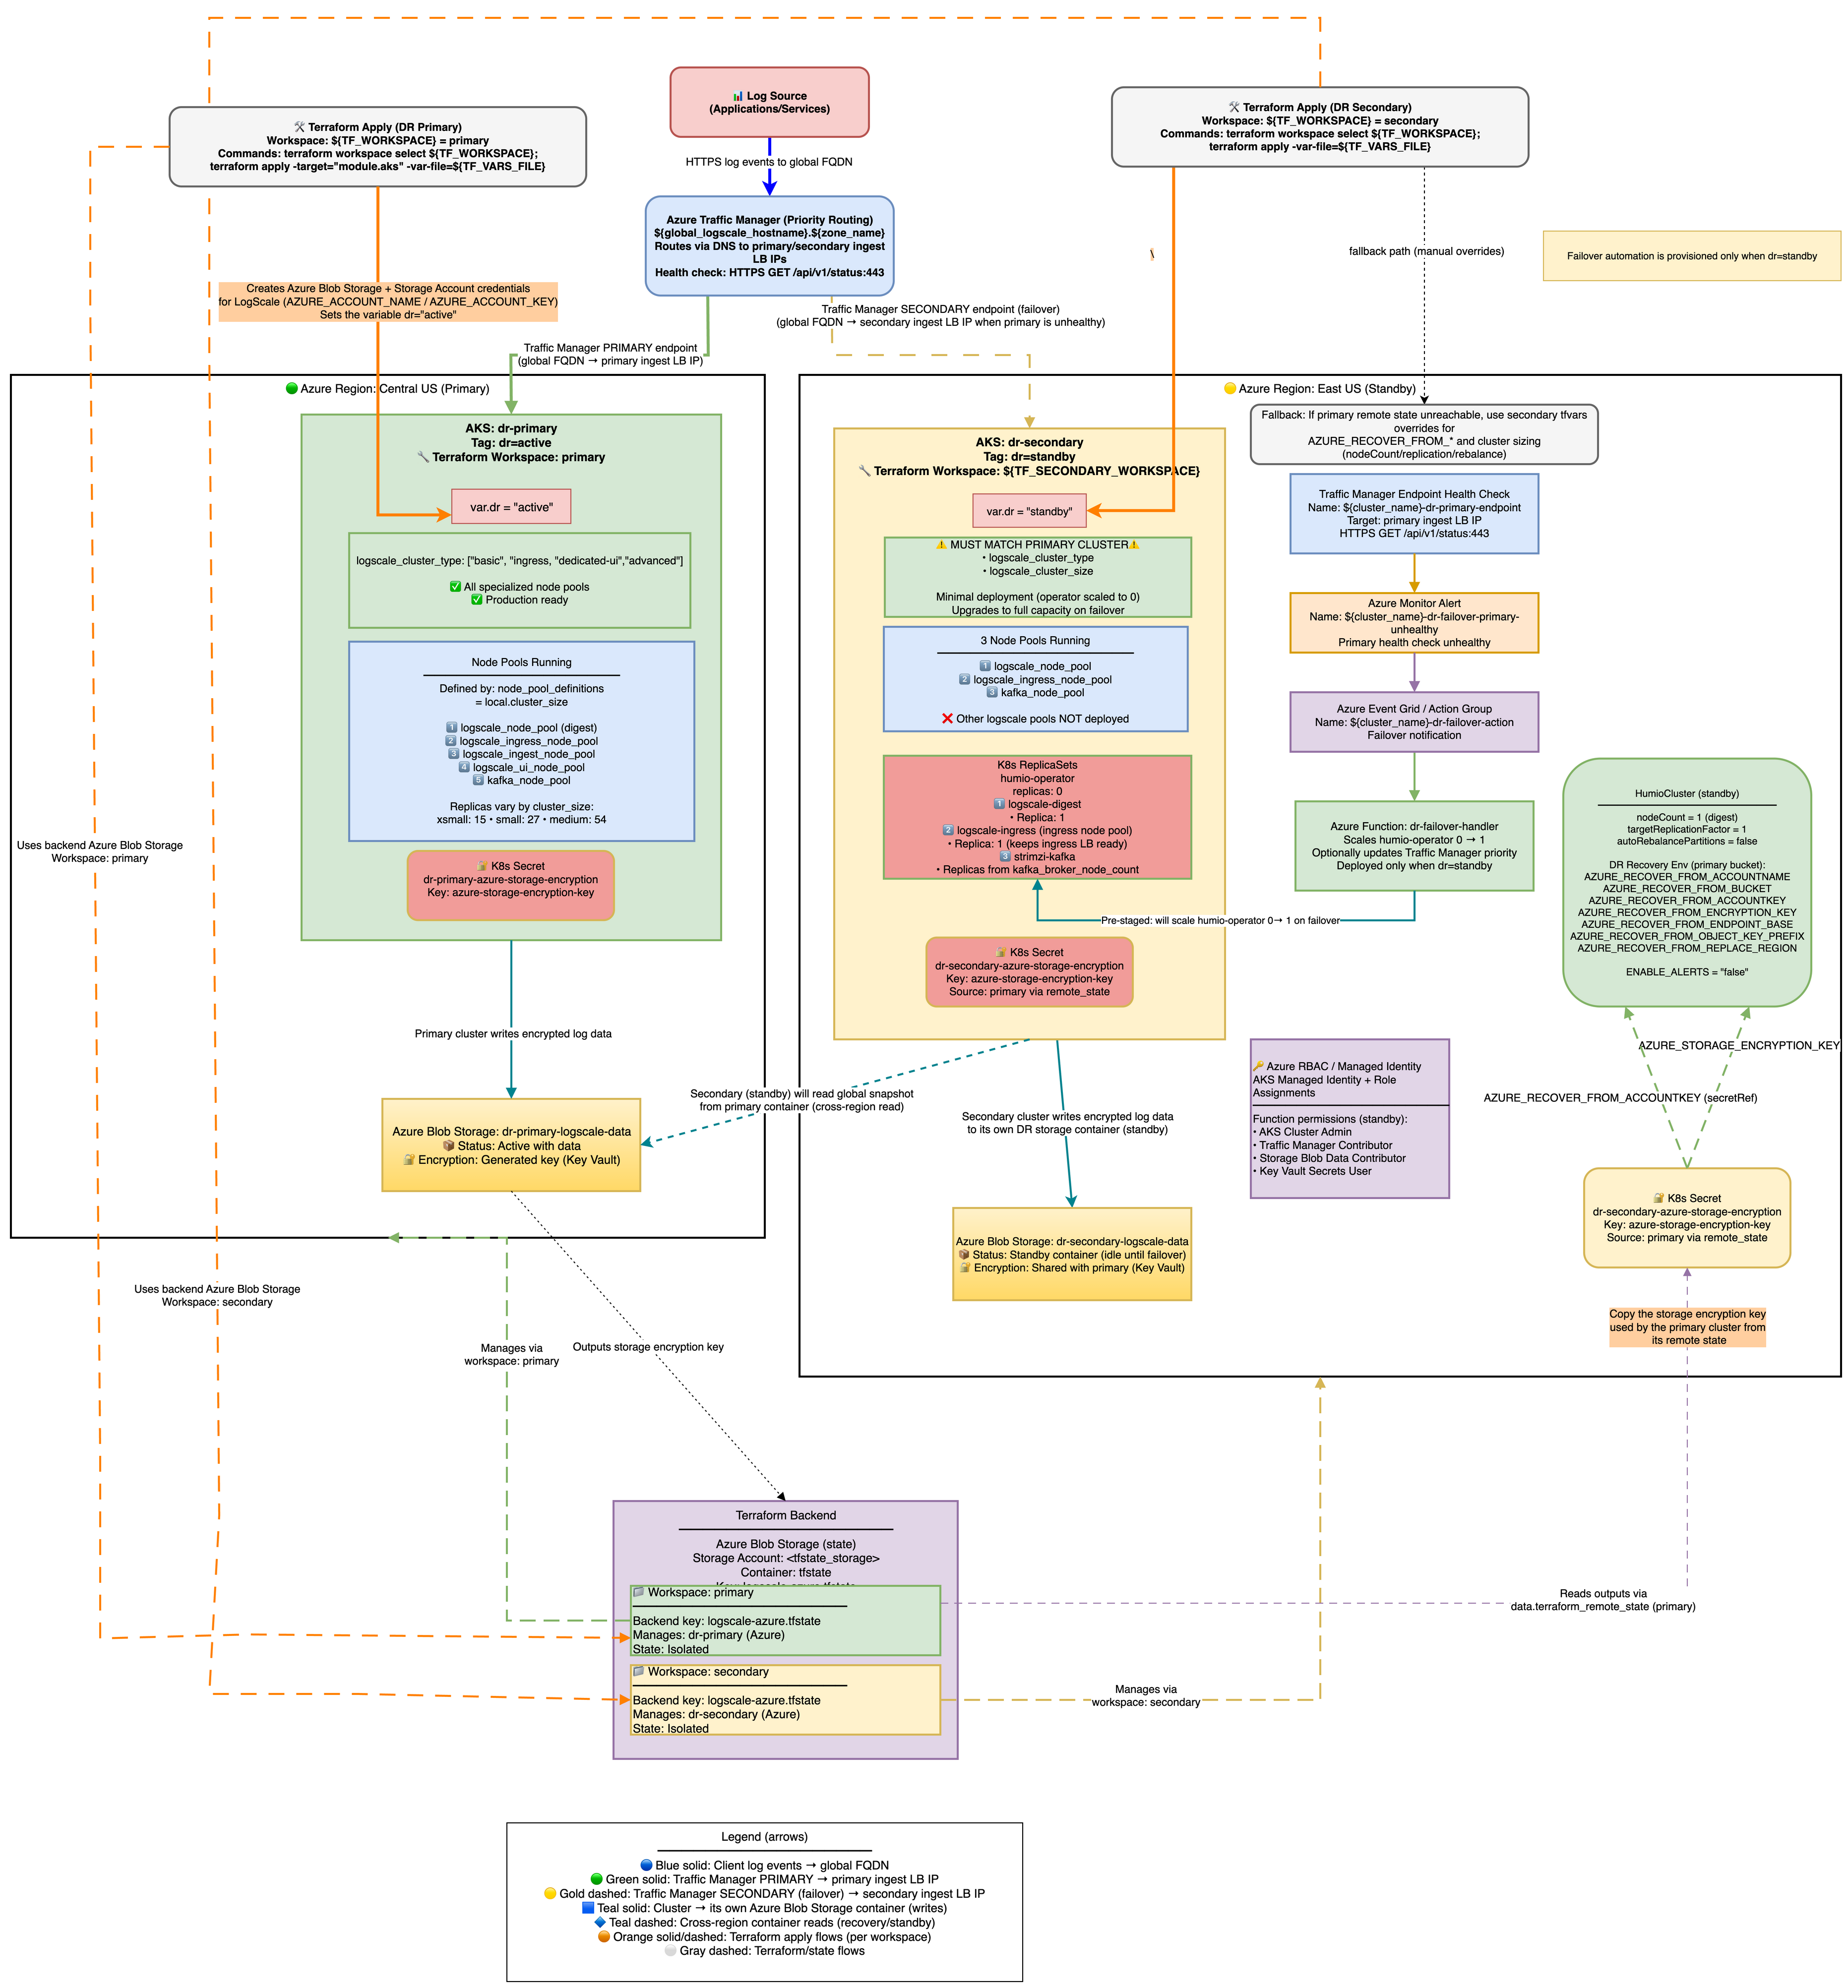 |
Azure DR Recovery Environment Variables
The following AZURE_RECOVER_FROM_* environment
variables are deployed only on the secondary (standby) cluster. They are
automatically set by Terraform (in locals.tf) when
dr = "standby" - no manual configuration is required. Their
values are derived from the primary cluster's remote state or fallback
tfvars variables.
These variables tell the standby LogScale instance where to find the primary cluster's storage bucket and how to authenticate to it. When the standby cluster is activated during failover (humio-operator scaled to 1), LogScale reads these variables at startup and performs the following recovery sequence:
Snapshot discovery - LogScale searches for the newest global snapshot in the primary's Azure Blob container using
AZURE_RECOVER_FROM_BUCKET,AZURE_RECOVER_FROM_ACCOUNTNAME,AZURE_RECOVER_FROM_ACCOUNTKEY, andAZURE_RECOVER_FROM_ENDPOINT_BASEto authenticate and locate the data.Snapshot download - The global snapshot is downloaded from the primary bucket at the path specified by
AZURE_RECOVER_FROM_OBJECT_KEY_PREFIX(e.g., z072ef-drpri/globalsnapshots/), and decrypted usingAZURE_RECOVER_FROM_ENCRYPTION_KEY.Snapshot patching - LogScale patches the recovered snapshot to adapt it for the secondary cluster:
Replaces region strings in bucket configurations using
AZURE_RECOVER_FROM_REPLACE_REGION(e.g., centralus → eastus2)Marks the primary bucket as read-only (the secondary reads existing segments from primary but writes new segments to its own bucket)
Resets host assignments and cluster partition state so the secondary can reassign them
Bootstrap - The patched snapshot initializes LogScale's data layer on the secondary cluster, effectively restoring the primary's metadata (repos, users, dashboards, ingest tokens, etc.) while redirecting new writes to the secondary's own storage account.
For the full env var tables (AZURE_RECOVER_FROM_* and
common DR variables like BUCKET_STORAGE_MULTIPLE_ENDPOINTS
and ENABLE_ALERTS), see
Environment Variables.
Why
BUCKET_STORAGE_MULTIPLE_ENDPOINTS=true is Required for Azure
DR
In Azure, each storage account has a unique endpoint URL (for example:
primaryacct.blob.core.windows.net and
secondaryacct.blob.core.windows.net). This differs from
AWS S3 or GCS where buckets in the same region share a common endpoint.
The problem without this setting:
By default, LogScale assumes all buckets use the same endpoint
When the standby cluster starts, it overwrites ALL bucket endpoints with its own endpoint
This means the primary bucket's data becomes inaccessible because LogScale tries to reach
primaryacctdata through thesecondaryacctendpointResult: 403 authentication errors during DR recovery
What this setting does:
Tells LogScale to treat each bucket's endpoint configuration independently
The primary bucket keeps pointing to
primaryacct.blob.core.windows.netThe secondary bucket keeps pointing to
secondaryacct.blob.core.windows.netResult: DR recovery works because each bucket is accessed via its correct endpoint
How it's configured:
Terraform automatically sets this when dr is not empty (see
locals.tf)Both primary (
dr="active") and standby (dr="standby") clusters get this settingNo manual configuration required
Verification:
# Check the env var is set on the HumioCluster
kubectl get humiocluster -n logging -o jsonpath='{.items[0].spec.environmentVariables}' | \
  jq '.[] | select(.name=="BUCKET_STORAGE_MULTIPLE_ENDPOINTS")'
# Expected: {"name":"BUCKET_STORAGE_MULTIPLE_ENDPOINTS","value":"true"}
Why
AZURE_RECOVER_FROM_REPLACE_BUCKET is NOT set:
Azure storage accounts have unique endpoints (for example:
primaryacct.blob.core.windows.net), unlike S3/OCI which
share regional endpoints. Setting REPLACE_BUCKET would swap
container names but keep the secondary's endpoint, causing 403
authentication errors. Instead, use
AZURE_RECOVER_FROM_ACCOUNTNAME to point directly to the
primary storage account. During recovery, the bucket entity from the
primary snapshot is marked readOnly=true, which prevents
LogScale from uploading new segments to it. New segments are
written only to the secondary's own bucket.
Stage 2: Failover - Scale up Humio and read global snapshot
The architecture is shown in the following diagram:
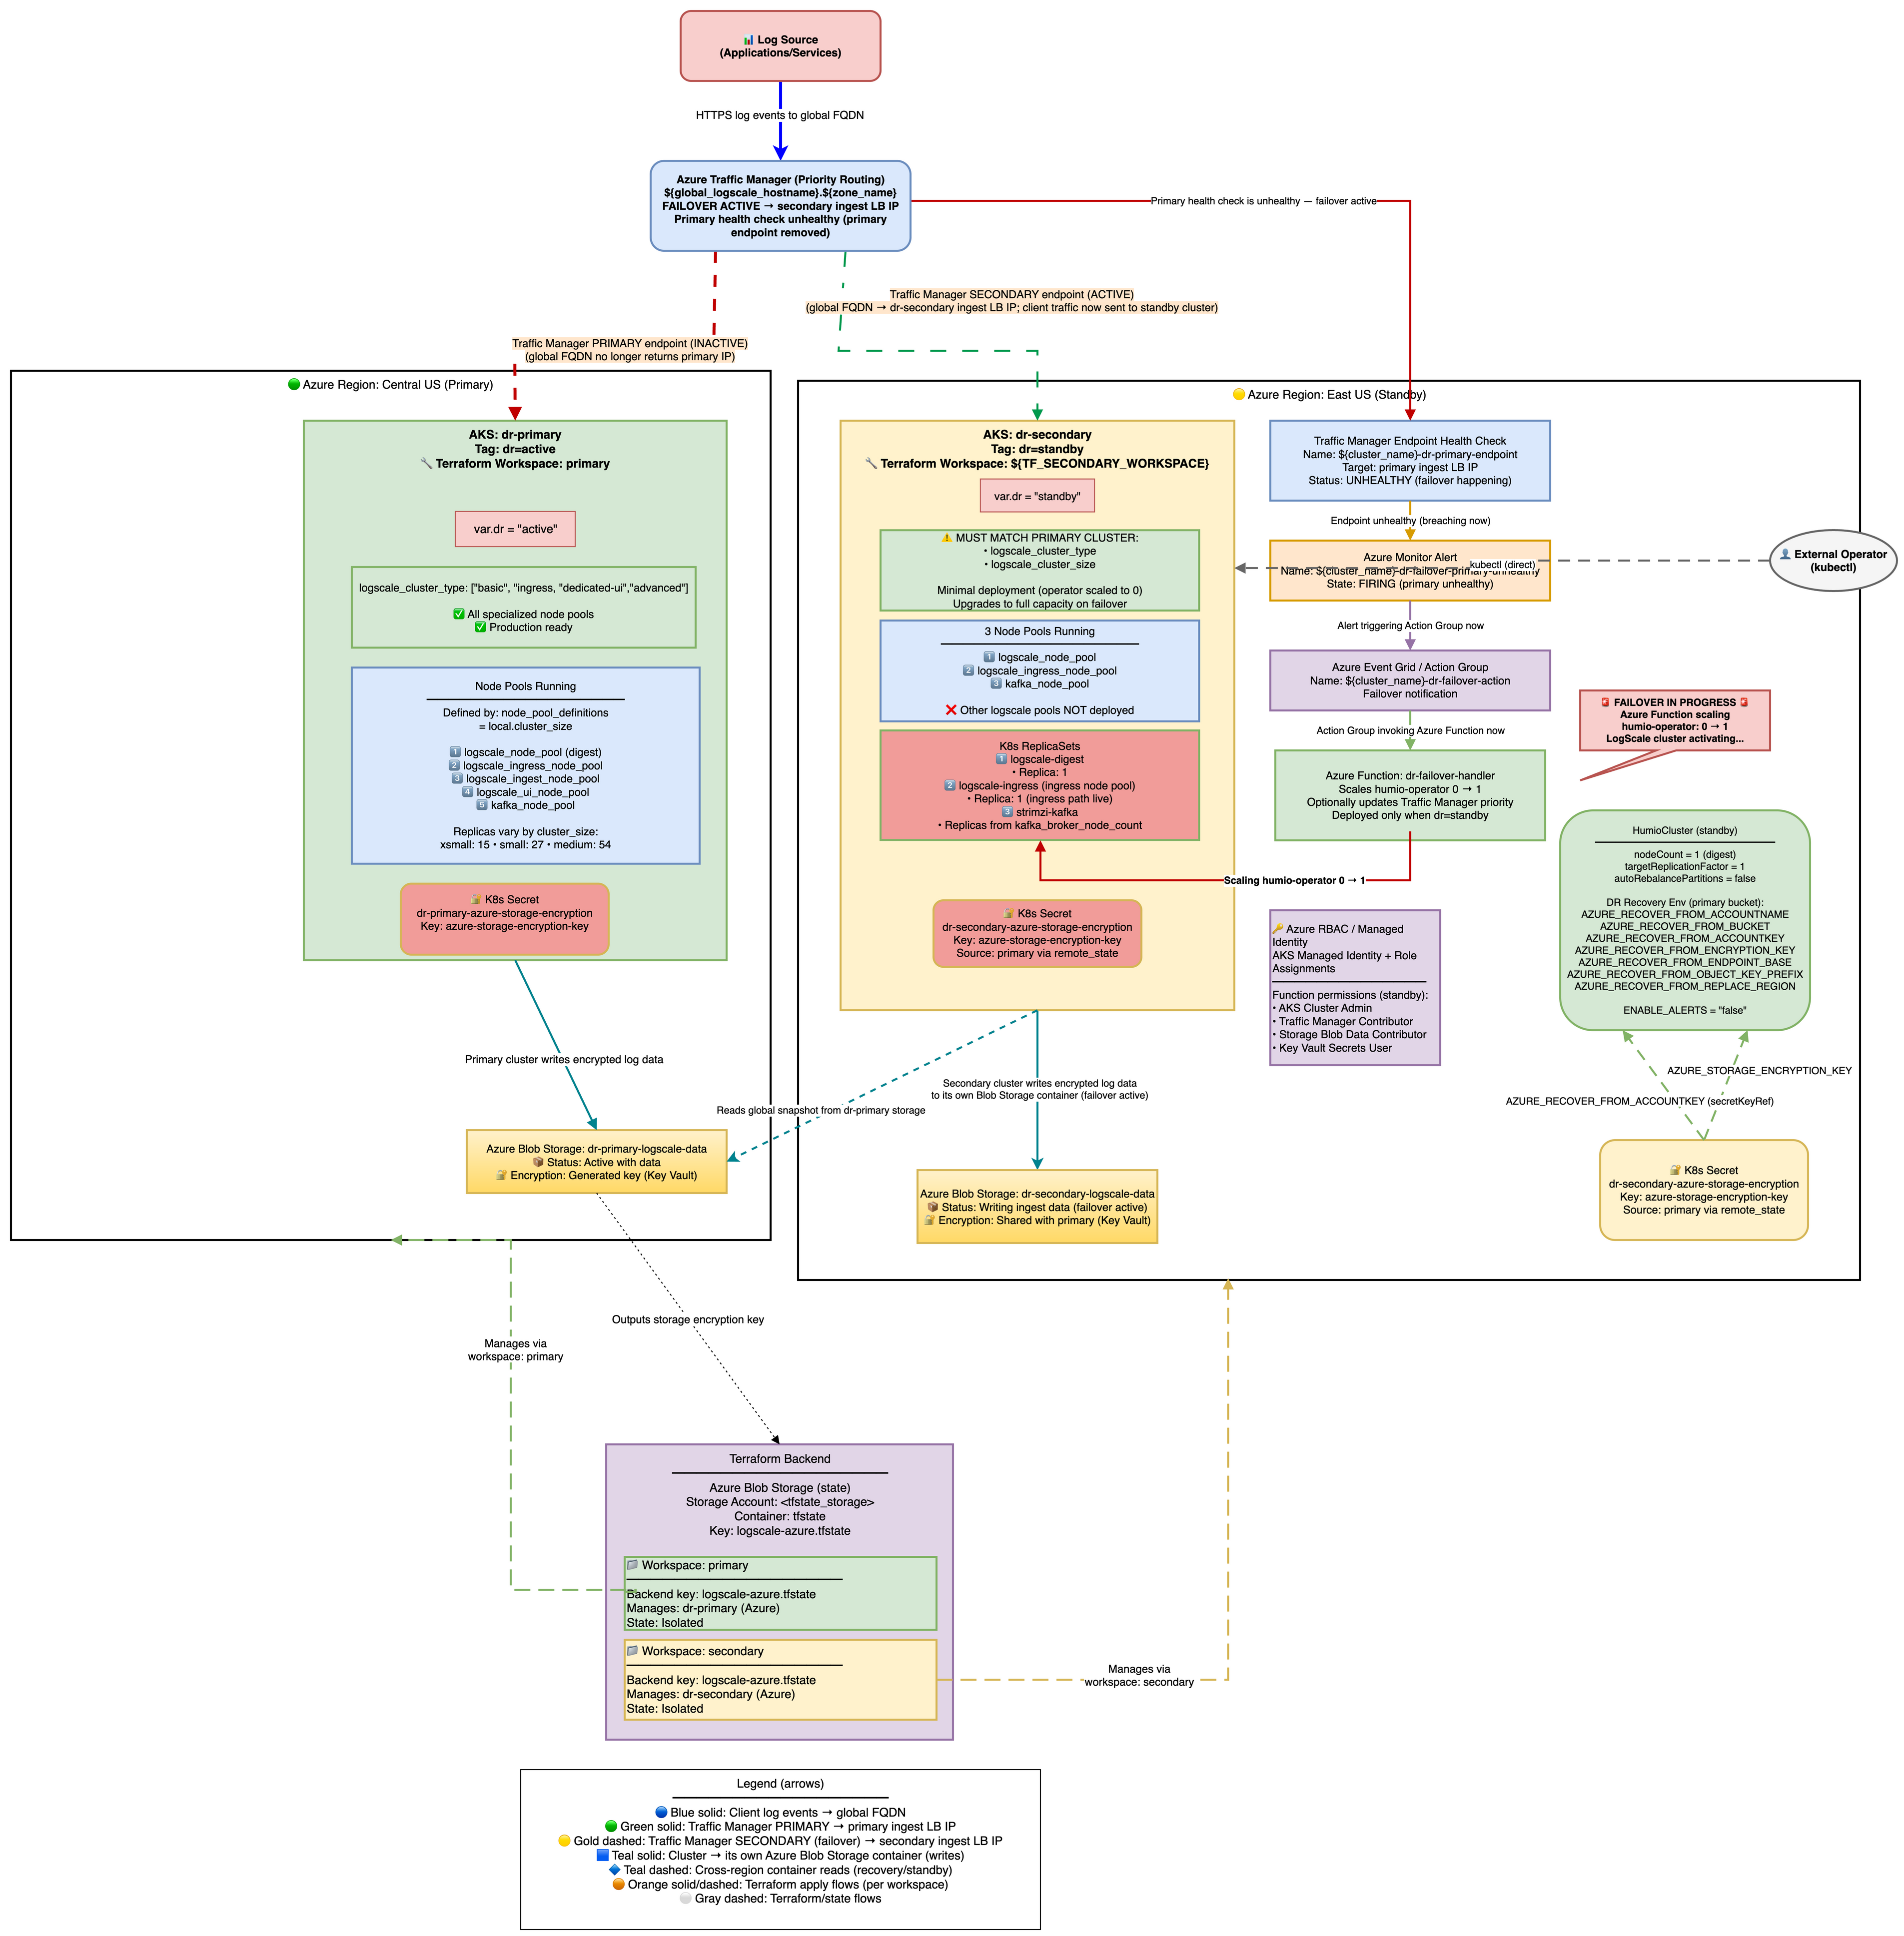 |
Secondary Readiness Required Steps
Run on secondary to ensure it's ready to promote later.
On standby, the HumioCluster already declares nodeCount=1,
but the Humio operator is scaled to 0. When the Humio Operator is scaled
to 1 (by the Azure Function on health check failure or manually), it
reconciles the HumioCluster and starts a single LogScale pod.
That pod detects the AZURE_RECOVER_FROM_* environment
variables, fetches the global snapshot from the primary Azure Blob
container, patches bucket/region references to the secondary, marks the
primary container read-only, clears host/partition assignments, and
writes the patched snapshot to the secondary container.
Scale the Humio operator on secondary
With Azure Function enabled (default): Traffic Manager health check failure → Azure Monitor Alert → Azure Function scales humio-operator replicas to 1. No further action needed.
Manually (for example, for tests or if Azure Function is disabled):
shellkubectl --context aks-secondary -n logging scale deploy humio-operator --replicas=1
Do not patch
spec.nodeCountit is already set to 1. The operator must be running for the Humio pod to start.What Happens After Operator Starts:
The Humio operator reconciles and creates the Humio pod.
The pod reads
AZURE_RECOVER_FROM_*env vars.It lists and downloads the latest
global-snapshot.jsonfrom the primary container.It patches the snapshot to reference the secondary container/region and credentials.
It loads the patched snapshot into memory.
The cluster starts up with the recovered metadata state; data segments remain in the primary container (read-only access).
Spot-check pods on secondary:
shellkubectl --context aks-secondary -n logging get pods # Expect humio-operator (1/1), one Humio pod once recovery starts, and Kafka components running
DNS Architecture and Traffic Flow
This section explains how users access LogScale from a DNS perspective and how traffic flows through the system during normal operations and failover scenarios. For the full URL tables and DNS resolution details, see DNS Architecture.
Traffic Flow Diagrams
Normal Operation (Primary Healthy):
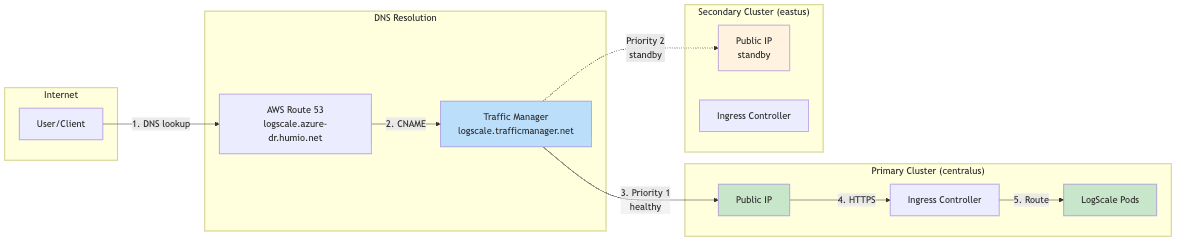 |
During Failover (Primary Unhealthy):
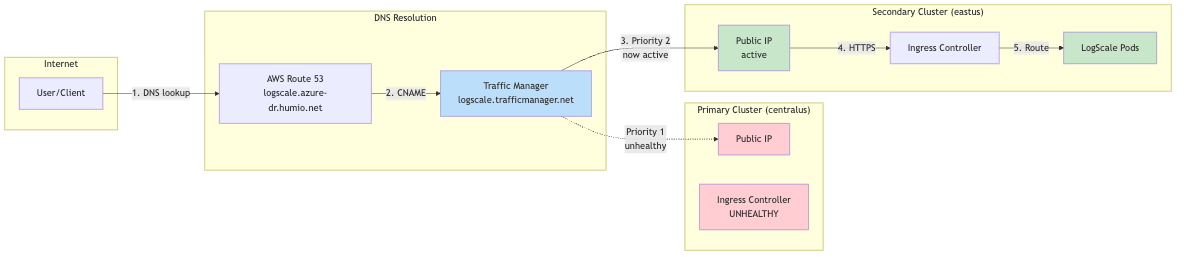 |
Why Two URL Types?
| Aspect | Cluster-Specific URL | Global DR URL |
|---|---|---|
| Failover | No automatic failover | Automatic via Traffic Manager |
| Use case | Direct cluster management, debugging | Production client access |
| DNS TTL | Standard Azure DNS | Low TTL (60s) for fast failover |
| Health checks | None | Traffic Manager probes /api/v1/status |
Client Configuration Recommendation
For production clients (log shippers, applications):
Use the global DR URL: https://<global_hostname>.<dns_zone>
Automatic failover with no client reconfiguration needed
For cluster administration:
Use cluster-specific URLs for direct access
Primary: https://<primary-prefix>.<region>.cloudapp.azure.com
Secondary: https://<secondary-prefix>.<region>.cloudapp.azure.com
Traffic Routing During Failover
During failover, all traffic is directed to the single LogScale digest pod via Kubernetes label selectors. Understanding these labels is critical for troubleshooting traffic routing issues.
Label Selectors Used:
| Label | Value | Purpose |
|---|---|---|
app.kubernetes.io/name
| humio | Generic label matching ANY LogScale pod |
humio.com/node-pool
| <cluster-name> | Pool-specific label for digest pods |
Verify DR Recovery Succeeded (logs and snapshot)
Verifying failover recovery:
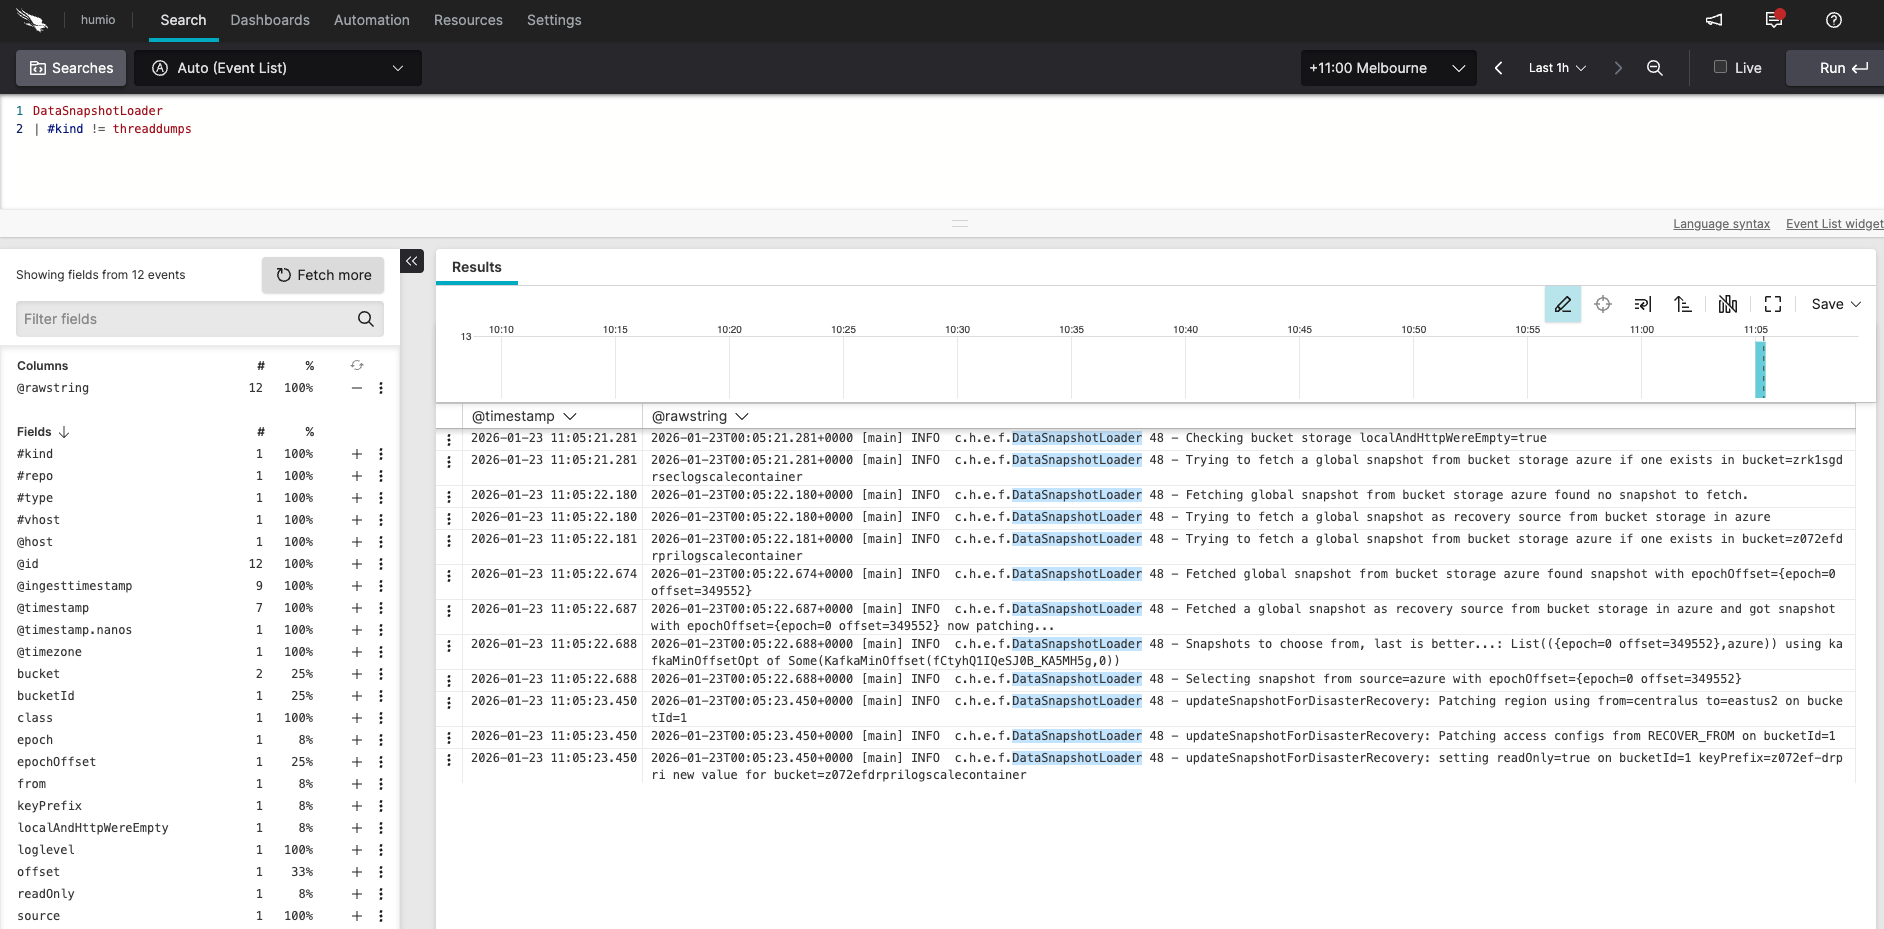 |
Log in to the secondary LogScale cluster UI, open the Humio repository, and run the following query:
DataSnapshotLoader
| #kind != threaddumps
You should see messages similar to:
Checking bucket storage localAndHttpWereEmpty=true
Trying to fetch a global snapshot from bucket storage azure if one exists in bucket=secondarylogscalecontainer
Fetching global snapshot from bucket storage azure found no snapshot to fetch.
Trying to fetch a global snapshot as recovery source from bucket storage in azure
Trying to fetch a global snapshot from bucket storage azure if one exists in bucket=primarylogscalecontainer
Fetched global snapshot from bucket storage azure found snapshot with epochOffset={epoch=0 offset=1329609}
Fetched a global snapshot as recovery source from bucket storage in azure and got snapshot with epochOffset={epoch=0 offset=1329609} now patching...
Snapshots to choose from, last is better...; List({epoch=0 offset=1329609},azure)) using kafkaMinOffsetOpt of Some(KafkaMinOffset(...))
Selecting snapshot from source=azure with epochOffset={epoch=0 offset=1329609}
updateSnapshotForDisasterRecovery: Patching region using from=eastus to=westus on bucketId=1
updateSnapshotForDisasterRecovery: Patching bucket using from=primarylogscalecontainer to=secondarylogscalecontainer on bucketId=1
updateSnapshotForDisasterRecovery: Patching access configs from RECOVER_FROM on bucketId=1
updateSnapshotForDisasterRecovery: setting readOnly=true on bucketId=1 keyPrefix= new value for bucket=secondarylogscalecontainer
Inspect the snapshot file on a secondary pod:
kubectl config use-context aks-secondary
POD=$(kubectl -n logging get pod -l app.kubernetes.io/name=humio -o jsonpath='{.items[0].metadata.name}')
kubectl -n logging exec "$POD" -c humio -- cat /data/humio-data/global-data-snapshot.json | head -60
# Confirm bucket/region reflect the secondary and readOnly flags are correct
Ready to promote when:
Operator is 1/1 on secondary.
Kafka components exist on secondary after re-apply.
DataSnapshotLoader logs match the expected sequence above.
Snapshot file shows patched region/bucket pointing to secondary; encryption keys match.
Stage 3: Promote Secondary to Active
In the third phase of failover, you promote the secondary cluster to active. The architecture is shown in the following diagram:
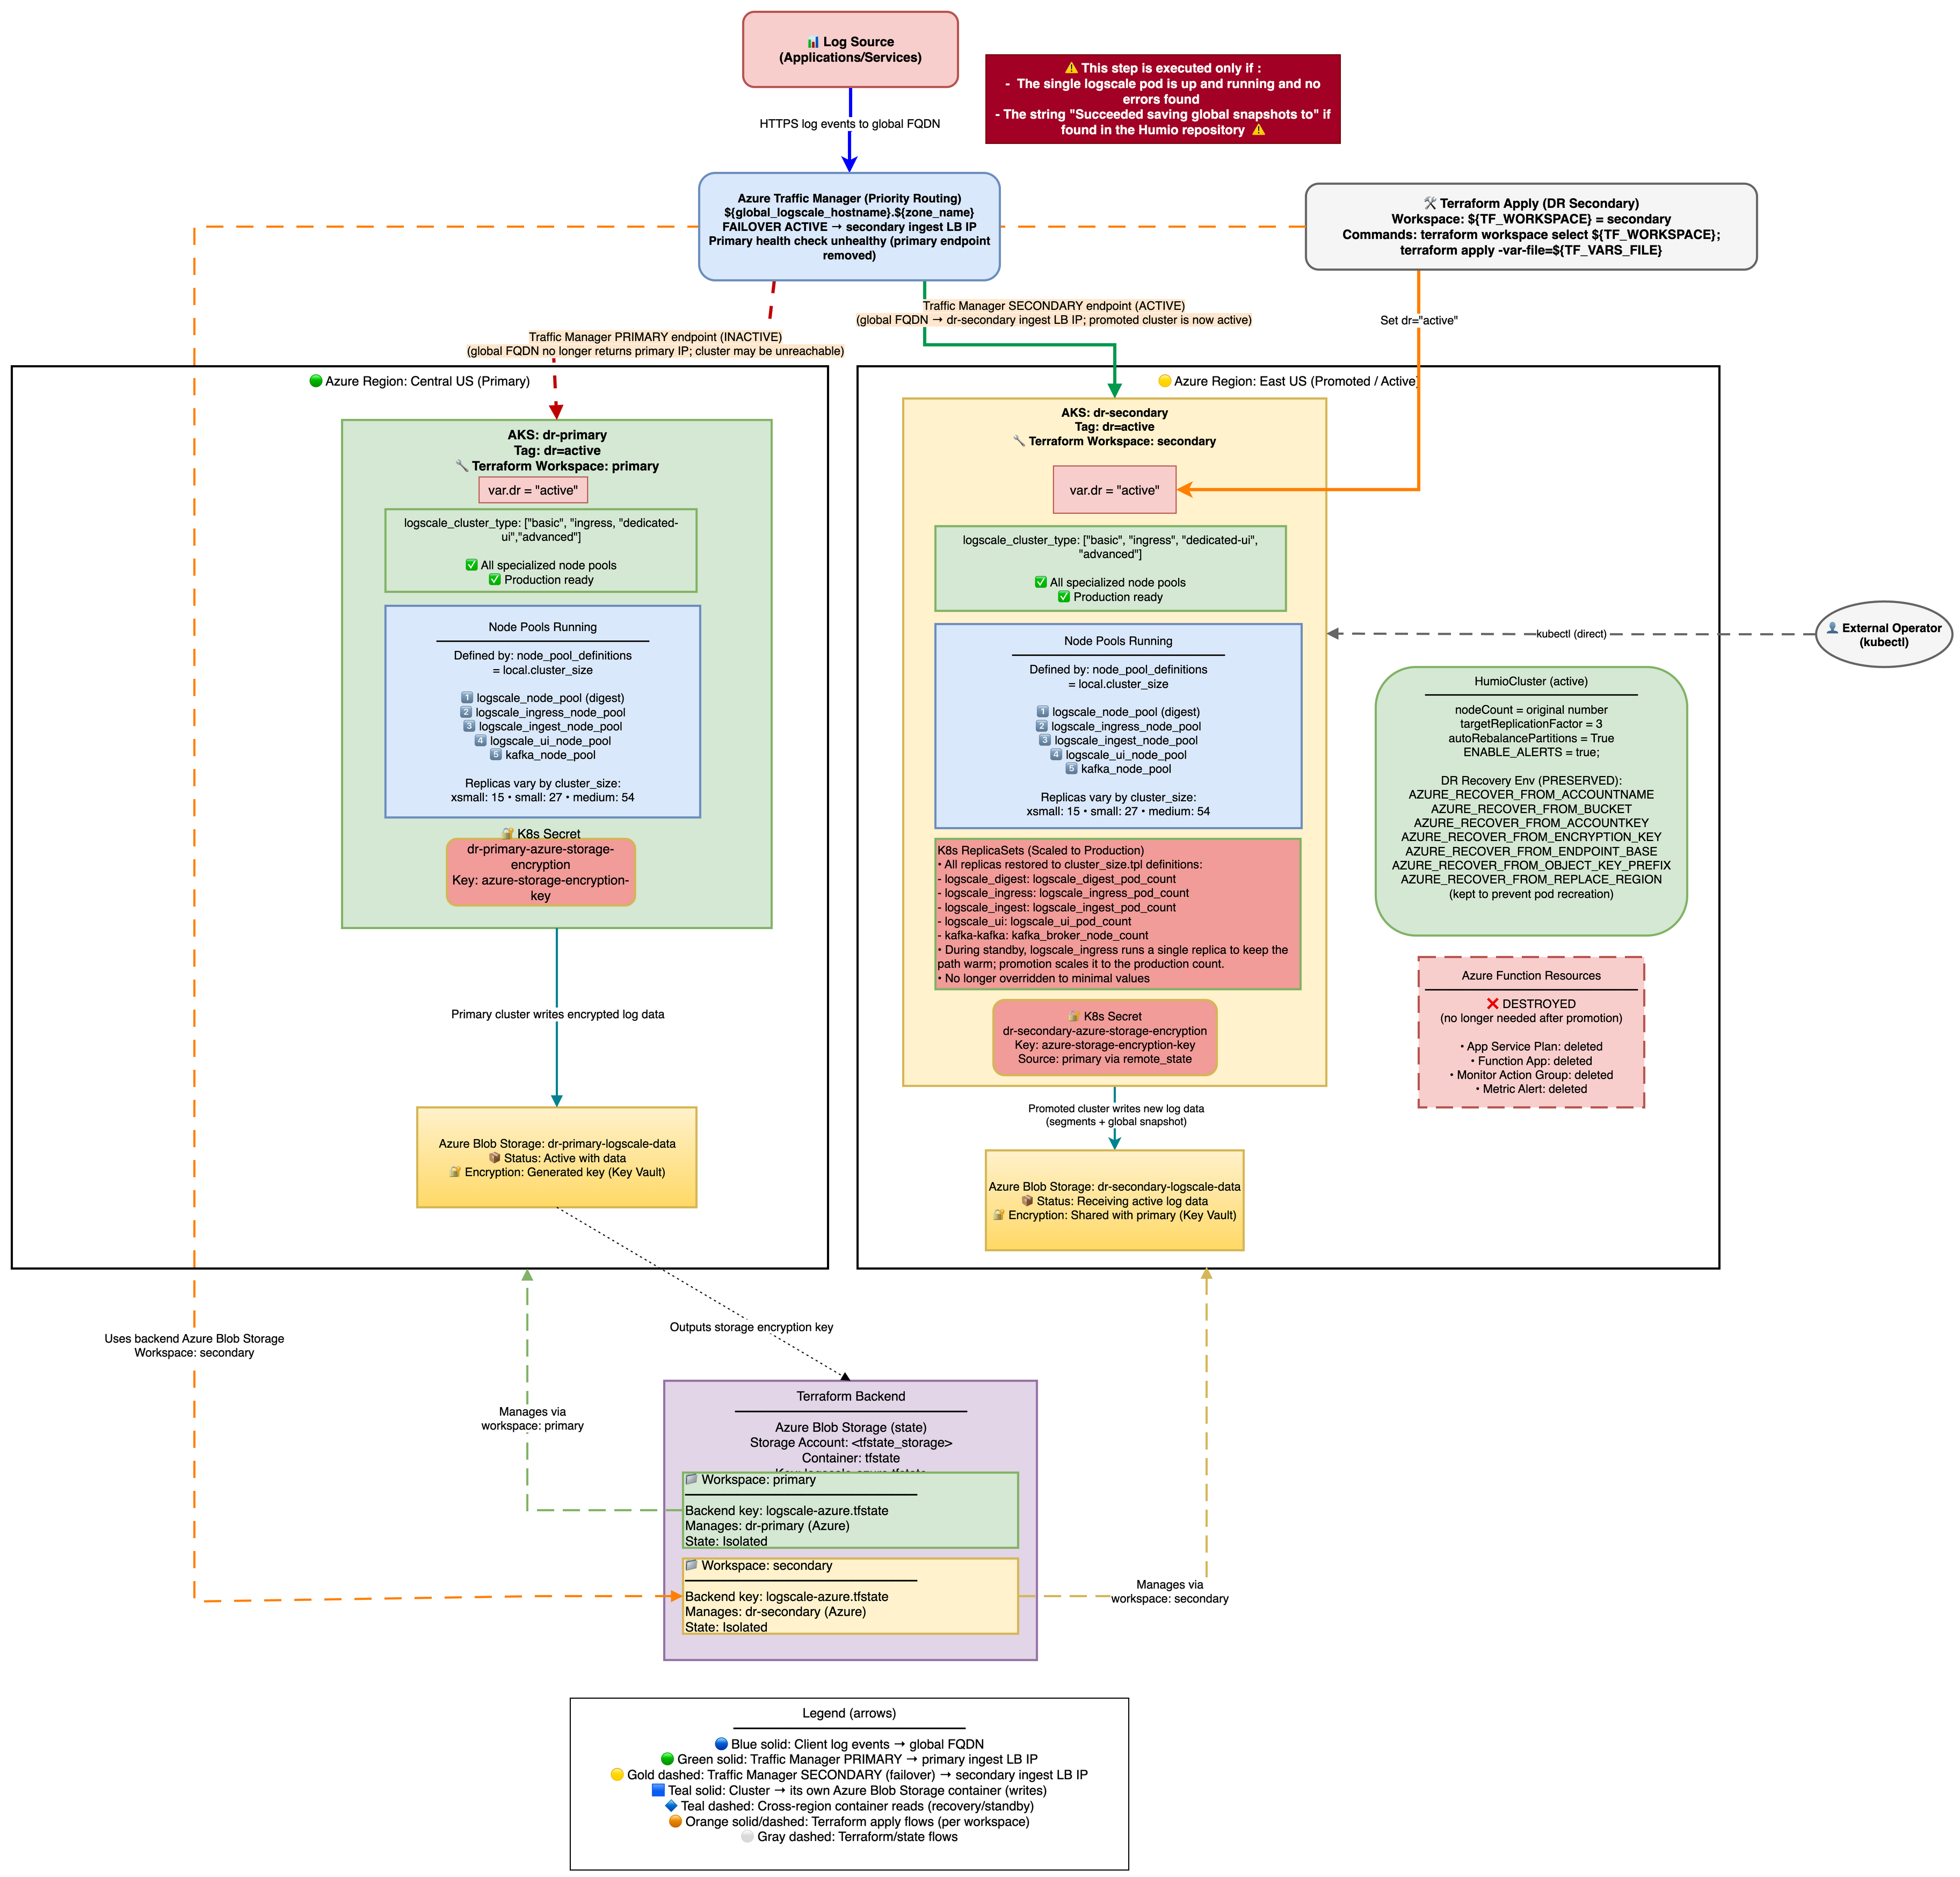 |
Once the LogScale pod is running and has successfully read the global snapshot from the primary Azure Blob container, the cluster can be promoted to active status.
Zero-Downtime Promotion (Two-Phase Apply)
This promotes the secondary to active with zero downtime by keeping the digest pod serving all traffic while dedicated UI/Ingest node pools scale up.
Prerequisite - Preserve the Traffic Manager secondary endpoint:
Before promoting, remove the secondary Traffic Manager endpoint from
Terraform state so it is not destroyed when
dr-failover-function resources are cleaned up:
terraform workspace select default
terraform init -backend-config=backend-configs/production-secondary.hcl -reconfigure
terraform workspace select secondary
terraform state rm 'module.dr-failover-function[0].azapi_resource.traffic_manager_secondary_endpoint'
See Traffic Manager Behavior During DR for details on why this is necessary.
Phase 1 - Promote with shared routing:
# Edit tfvars: set active mode but keep shared routing
dr = "active"
dr_use_dedicated_routing = false  # digest pod serves UI + ingest traffic
terraform workspace select secondary
terraform apply -var-file=secondary-<region>.tfvars
Phase 1 creates UI and Ingest node pools and scales the operator, but
ingress selectors use app.kubernetes.io/name=humio which
matches all LogScale pods including the existing digest pod. No
503s during this phase.
Wait for all new node pools and pods to be Running and Ready before proceeding to Phase 2:
# Wait for UI and Ingest node pools to be ready
kubectl --context aks-secondary get nodes -l agentpool=lsuinode --watch
kubectl --context aks-secondary get nodes -l agentpool=lsingestnode --watch
# Wait for all LogScale pods to be Running and Ready
kubectl --context aks-secondary -n logging get pods --watch
Phase 2 - Switch to dedicated routing:
Once UI and Ingest pods are Running and Ready:
# Edit tfvars: enable dedicated pool routing
vi secondary-<region>.tfvars
dr_use_dedicated_routing = true # route to dedicated UI/Ingest pods
terraform apply -var-file=secondary-<region>.tfvars
Phase 2 updates the ingress services to use pool-specific selectors (humio-ui, humio-ingest), directing traffic to the dedicated pods. The transition is seamless because the new pods are already healthy.
What changes automatically:
Creates UI and Ingest node pools (if logscale_cluster_type requires them) - these are not present in standby mode.
Scales node groups to production sizes.
Sets production replication factor and enables auto-rebalance.
Enables alerts by setting
ENABLE_ALERTS=true.Humio operator scales to 1 and HumioCluster nodeCount follows production values.
Azure Function resources are destroyed (no longer needed on active cluster).
Verification after each phase
After Phase 1 (shared routing):
UI and Ingest node pools should exist:
kubectl --context
            aks-secondary get nodes -l agentpool=ui
All pods should be Running and Ready:
kubectl --context
            aks-secondary -n logging get pods
No 503s or dropped connections on the global DR FQDN
Health check returns HTTP 200:
curl -sk
            https://<global-dr-fqdn>/api/v1/status
After Phase 2 (dedicated routing):
Traffic Manager shows secondary endpoint as Online:
az network
            traffic-manager endpoint show --profile-name <tm-profile>
            --name <secondary-endpoint> --resource-group <tm-rg>
            --type externalEndpoints --query endpointMonitorStatus -o tsv
Global DR FQDN still returns HTTP 200
Verify no alerts re-fire during the transition (check Azure Monitor)
Ingress services use pool-specific selectors:
kubectl
            --context aks-secondary -n logging get svc -o wide
Traffic Manager Behavior During DR
Endpoint Architecture
Traffic Manager uses Priority routing with two external endpoints:
Primary endpoint (priority 1) - created by module "traffic-manager" in the primary Terraform state (
manage_traffic_manager = true && dr = "active")Secondary endpoint (priority 2) - created by
azapi_resource.traffic_manager_secondary_endpointin moduledr-failover-functionin the secondary Terraform state (dr = "standby")
The secondary cluster discovers the Traffic Manager profile from the primary's remote state - no manual wiring required.
Key point: The TM profile and primary endpoint live in the primary Terraform state. During a failover, nobody runs terraform apply on the primary state, so the TM profile and both endpoints persist in Azure unchanged. Traffic Manager health probes independently detect the primary is down and route traffic to the secondary (priority 2).
Note
Known gap: The secondary TM endpoint is currently inside module
"dr-failover-function", which has count = var.dr ==
"standby". When you promote the secondary (dr =
"active"), terraform apply will attempt to destroy this
endpoint along with the Azure Function resources. To prevent this,
terraform state rm the endpoint before promoting.
Automatic Failback Prevention
Design goal: After failover, traffic must never automatically return to the primary. A recovering primary may pass health probes but have inconsistent data or missing ingest.
Three independent layers prevent automatic failback:
Azure Function disables the primary endpoint - during failover,
disable_primary_tm_endpoint()setsendpointStatus = Disabledvia the Azure Management API. Even if the primary recovers, Traffic Manager will not route to a disabled endpoint. Requires Traffic Manager Contributor role (azurerm_role_assignment.function_tm_contributor).No terraform apply on primary during DR - the primary endpoint is defined with
enabled = truein Terraform. Running terraform apply on the primary workspace would re-enable it, but this never happens during a failover event.Alert resolution does not re-enable the endpoint - when the primary recovers and the alert resolves, the function only clears the holdoff tracking (degraded-since annotation). The endpoint stays Disabled until a human re-enables it.
The endpoint disable is non-fatal - if it fails, operator scaling still completes. However, this leaves a window where Traffic Manager could route back to a recovering primary.
Post-Failover Verification
Important
Verify the primary endpoint is disabled immediately after any failover.
# Primary should show endpointStatus=Disabled
az network traffic-manager endpoint show \
  --resource-group <tm-resource-group> \
  --profile-name <tm-profile-name> \
  --name <primary-endpoint-name> \
  --type externalEndpoints \
  --query '{name: name, status: endpointStatus, monitor: endpointMonitorStatus}' -o table

# If endpointStatus is still "Enabled", disable it manually:
az network traffic-manager endpoint update \
  --resource-group <tm-resource-group> \
  --profile-name <tm-profile-name> \
  --name <primary-endpoint-name> \
  --type externalEndpoints \
  --endpoint-status Disabled

# Secondary should show endpointStatus=Enabled, endpointMonitorStatus=Online
az network traffic-manager endpoint show \
  --resource-group <tm-resource-group> \
  --profile-name <tm-profile-name> \
  --name <secondary-endpoint-name> \
  --type externalEndpoints \
  --query '{name: name, status: endpointStatus, monitor: endpointMonitorStatus}' -o table

# DNS should resolve to secondary IP
nslookup <global_logscale_hostname>.trafficmanager.net
If the disable failed, check Application Insights for the cause:
traces
| where message has "disable" and message has "TM endpoint"
| project timestamp, message, severityLevel
| order by timestamp desc
| take 5
Manual Failback Procedure
Failback is never automatic. It is a deliberate, operator-driven process. The procedure below preserves data ingested during the failover window by loading the secondary's latest snapshot onto the primary before it resumes writes.
Skip the reverse recovery phases (Phase 3) if no data was ingested on the secondary during the failover window, or if data loss during that window is acceptable. In that case, only Phase 1, Phase 2, and Phase 5 are required.
Automation: An example of how to perform the failback procedure is shown
in test/simulate-azure-dr-failover.sh:
./simulate-azure-dr-failover.sh failback        # Phases 1-3 and 5
./simulate-azure-dr-failover.sh clean-secondary  # Phase 4
Phase 1 - Alert Management
Step 1: Disable the DR failover alert to prevent the Azure Function from re-triggering while you restore the primary.
# Get alert name and resource group from secondary Terraform state
terraform init -backend-config=backend-configs/production-secondary.hcl -reconfigure
DR_ALERT_NAME=$(terraform output -raw "dr-failover-alert_name")
SECONDARY_RG=$(terraform output -raw "azure-load-balancer-resource-group")

az monitor metrics alert update \
  --name "$DR_ALERT_NAME" \
  --resource-group "$SECONDARY_RG" \
  --enabled false
Step 1b: Clear the degraded-since annotation on the secondary humio-operator. This resets the holdoff tracking so the function starts fresh if failover is triggered again later.
kubectl --context aks-secondary -n logging \
  annotate deployment humio-operator \
  logscale.dr/degraded-since-epoch- \
  --overwrite
Phase 2 - Primary Cluster Restoration
Step 2: Re-enable the primary Traffic Manager endpoint. The Azure Function disabled it during failover to prevent automatic failback. Traffic Manager will not route to the primary until this is done.
az network traffic-manager endpoint update \
  --resource-group <tm-resource-group> \
  --profile-name <tm-profile-name> \
  --name <primary-endpoint-name> \
  --type externalEndpoints \
  --endpoint-status Enabled
Step 3: Scale the primary humio-operator to 1 (if it was scaled to 0 during testing or after a full region failure):
kubectl --context aks-primary -n logging \
  scale deploy humio-operator --replicas=1
Step 4: Restore primary nginx-ingress if it was scaled to 0 during testing (scaling ingress to 0 is required to trigger Traffic Manager failover during controlled tests):
# Check current replica count
kubectl --context aks-primary -n logging-ingress get deploy
# If replicas=0, restore:
kubectl --context aks-primary -n logging-ingress \
  scale deploy <ingress-controller-name> --replicas=1
Step 5: Wait for Traffic Manager to show the primary endpoint as "Online":
# Poll until endpointMonitorStatus is "Online"
az network traffic-manager endpoint show \
  --profile-name <tm-profile-name> \
  --name <primary-endpoint-name> \
  --resource-group <tm-resource-group> \
  --type externalEndpoints \
  --query endpointMonitorStatus -o tsv
Step 5a: Clear all fired alerts immediately after Traffic Manager shows Online. This must happen before secondary cleanup - otherwise the Azure Function may re-trigger while you are resetting the secondary:
SUB_ID=$(az account show --query id -o tsv)

# Find fired alerts for the DR alert rule
ALERT_IDS=$(az rest --method get \
  --uri "https://management.azure.com/subscriptions/${SUB_ID}/providers/Microsoft.AlertsManagement/alerts?api-version=2019-05-05-preview" \
  -o json | jq -r --arg name "$DR_ALERT_NAME" '
  [.value[] |
   select(.properties.essentials.monitorCondition == "Fired") |
   select(.properties.essentials.alertState != "Closed") |
   select(.properties.essentials.alertRule | test($name + "$"))] |
   .[].id')

for id in $ALERT_IDS; do
  az rest --method post \
    --uri "https://management.azure.com${id}/changeState?api-version=2019-05-05-preview&newState=Closed"
done
Phase 3 - Reverse Recovery (data-preserving failback)
This phase loads data ingested by the secondary during the failover
window back onto the primary. It works by cold-starting the primary with
AZURE_RECOVER_FROM_* environment variables pointing
at the secondary's storage bucket. Skip this phase if no data was
ingested during failover or if data loss is acceptable.
Prerequisite: secondary_remote_state_config must be
set in the primary tfvars and a terraform apply must have been run on
the primary workspace at some point after the secondary was deployed.
The reverse_recovery_envvars output must be
non-empty:
terraform init -backend-config=backend-configs/production-primary.hcl -reconfigure
terraform output reverse_recovery_envvars
# Must not be empty
Step 5b: Gracefully shut down secondary LogScale to flush in-flight data to storage before we read from it.
Important: Small event batches may not have been flushed to Azure Storage yet. Before shutting down, enable FlushSegmentsAndGlobalOnShutdown via the LogScale GraphQL API. This forces LogScale to write ALL in-memory segments and a fresh global snapshot on SIGTERM, preventing data loss for recently ingested events that haven't reached the automatic flush threshold.
Step 5b-1: Enable flush-on-shutdown on the secondary LogScale cluster:
Note: LogScale's internal HTTP port (8080) is used below because
the command runs inside the pod via kubectl exec. If your
LogScale configuration enables TLS on the internal port, use
https://localhost:8080 and add -k to skip certificate verification.
Alternatively, use a port-forward approach as shown in
enable_flush_on_shutdown() in
test/simulate-azure-dr-failover.sh.
# Get a LogScale pod name
HUMIO_POD=$(kubectl --context aks-secondary -n logging \
  get pod -l app.kubernetes.io/name=humio -o jsonpath='{.items[0].metadata.name}')
# Get the admin token from the HumioCluster admin-token secret
# (secret name is <humiocluster-name>-admin-token, not <humiocluster-name>-admin)
TOKEN=$(kubectl --context aks-secondary -n logging \
  get secret <humio-cluster>-admin-token -o jsonpath='{.data.token}' | base64 -d)

# Enable FlushSegmentsAndGlobalOnShutdown via GraphQL API
RESULT=$(kubectl --context aks-secondary -n logging exec "$HUMIO_POD" -- \
  curl -s -X POST http://localhost:8080/graphql \
  -H "Content-Type: application/json" \
  -H "Authorization: Bearer $TOKEN" \
  -d '{"query":"mutation { setDynamicConfig(input: {config: FlushSegmentsAndGlobalOnShutdown, value: \"true\"}) }"}')
echo "$RESULT" | grep -q '"setDynamicConfig":true' \
  && echo "OK: flush-on-shutdown enabled" \
  || echo "ERROR: setting not applied (response: $RESULT)"
Step 5b-2: Scale the operator to 0 and wait for pods to terminate. The flush-on-shutdown setting causes LogScale to write a fresh global snapshot during SIGTERM handling (this may take 1-3 minutes depending on data volume):
kubectl --context aks-secondary -n logging \
  scale deploy humio-operator --replicas=0

# Wait for LogScale pods to terminate (up to 5 minutes - flush may take time)
kubectl --context aks-secondary -n logging \
  wait --for=delete pod -l app.kubernetes.io/name=humio --timeout=300s
Step 5c: Verify the secondary has a usable global snapshot in Azure Blob Storage:
# List global snapshots in secondary storage
az storage blob list \
  --account-name <secondary-storage-account> \
  --container-name <secondary-storage-container> \
  --prefix "$(terraform output -raw AZURE_STORAGE_OBJECT_KEY_PREFIX)globalsnapshots/" \
  --query "[].{name:name, modified:properties.lastModified}" -o table
# Expect at least one snapshot with a recent lastModified timestamp
Step 5d: Stop the primary LogScale. This must happen before deleting primary snapshots to close the window where a new snapshot could be written between deletion and cold start.
kubectl --context aks-primary -n logging \
  scale deploy humio-operator --replicas=0

kubectl --context aks-primary -n logging \
  delete pods -l app.kubernetes.io/name=humio,app.kubernetes.io/managed-by=humio-operator \
  --ignore-not-found=true

# Wait for all LogScale pods to fully terminate before proceeding
kubectl --context aks-primary -n logging \
  wait --for=delete pod -l app.kubernetes.io/name=humio --timeout=180s
Step 5e: Delete ALL primary global snapshots from Azure Storage.
This step is required because DataSnapshotLoader only checks the
recovery bucket (AZURE_RECOVER_FROM_*) when no local
snapshot matching the Kafka cluster ID exists. The primary's own
snapshots share the same kafkaClusterId, so as long as any primary
snapshot exists, the recovery bucket is never consulted. Only snapshot
blobs are deleted - data segment blobs are preserved.
# Ensure we are reading from the primary workspace (if you were previously
# working in the secondary workspace, this switch is required - terraform output
# returns values from the currently selected workspace)
terraform init -backend-config=backend-configs/production-primary.hcl -reconfigure
terraform workspace select primary

# Snapshot blobs are stored under <prefix>globalsnapshots/
PRIMARY_PREFIX=$(terraform output -raw AZURE_STORAGE_OBJECT_KEY_PREFIX)

# Get the storage account key for authentication
STORAGE_KEY=$(az storage account keys list \
  --account-name <primary-storage-account> --query '[0].value' -o tsv)

az storage blob delete-batch \
  --account-name <primary-storage-account> \
  --account-key "$STORAGE_KEY" \
  --source <primary-storage-container> \
  --pattern "${PRIMARY_PREFIX}globalsnapshots/*"
Private endpoint restriction: If the storage account firewall blocks
external access (the default secure configuration), the az storage blob
delete-batch command above will fail with a 403 Forbidden error. In that
case, you must run the deletion from within the cluster network. The
simulation script
(test/simulate-azure-dr-failover.sh) handles this
automatically by spawning in-cluster Python pods with the
azure-storage-blob SDK. For manual operations, either temporarily add
your IP to the storage firewall or use the script's
delete_storage_container_blobs() function.
Step 5f: Patch the primary HumioCluster
with AZURE_RECOVER_FROM_* env vars pointing to the
secondary's storage. The values come from the
reverse_recovery_envvars Terraform output on the
primary workspace:
terraform init -backend-config=backend-configs/production-primary.hcl -reconfigure
RECOVERY_VARS=$(terraform output -json reverse_recovery_envvars)
The reverse_recovery_envvars output contains:
| Variable | Value |
|---|---|
AZURE_RECOVER_FROM_BUCKET
| Secondary container name |
AZURE_RECOVER_FROM_ACCOUNTNAME
| Secondary storage account name |
AZURE_RECOVER_FROM_ACCOUNTKEY
| Secondary storage account key |
AZURE_RECOVER_FROM_ENDPOINT_BASE
| Secondary blob endpoint URL |
AZURE_RECOVER_FROM_OBJECT_KEY_PREFIX
| Secondary object key prefix |
AZURE_RECOVER_FROM_ENCRYPTION_KEY
| Secondary encryption key |
AZURE_RECOVER_FROM_REPLACE_REGION
|
<secondary-region>/<primary-region>
(inverted from failover direction)
|
Note
BUCKET_STORAGE_MULTIPLE_ENDPOINTS is NOT included in
reverse_recovery_envvars because the primary
already has it via dr_common_envvars (set when
dr="active"). Adding it again would create a duplicate,
which the operator rejects.
Use kubectl patch to merge the recovery vars into the existing
spec.environmentVariables array on the HumioCluster.
The simulate-azure-dr-failover.sh script shows how
to perform this merge.
Step 5g: Reset the primary Kafka
global-events topic. The secondary's snapshot was
written using the secondary's Kafka epoch key. Loading it on the primary
without resetting Kafka causes a fatal crash: FATAL: The Kafka
epoch key has changed from X to Y.
Strimzi Kafka uses TLS on port 9093. The commonly documented
localhost:9092 plaintext bootstrap does not work when only TLS listeners
are configured. Additionally, running
kafka-topics.sh inside the Kafka pod's container
causes OOM - the 2 GB cgroup limit cannot support a second JVM process.
The helper script test/reset-kafka-topic.sh handles
this by:
Finding a running Kafka pod and extracting the cluster name and image
Checking whether the topic exists (filesystem check - no extra JVM)
Spawning a temporary admin pod that mounts the cluster CA cert from the
<cluster>-cluster-ca-certsecretBuilding a PKCS12 truststore and connecting to
<cluster>-kafka-bootstrap:9093with TLSRunning
kafka-topics.sh --delete --topic global-events
./test/reset-kafka-topic.sh --context aks-primary
Step 5h: Cold-start the primary by
scaling the operator from 0 to 1. With no running peers and no local
snapshot, DataSnapshotLoader will load from the
recovery bucket (the secondary's storage):
kubectl --context aks-primary -n logging \
  scale deploy humio-operator --replicas=1
Step 5i: Monitor recovery from the
secondary snapshot. Watch DataSnapshotLoader logs for
the expected sequence:
kubectl --context aks-primary -n logging \
  logs -l app.kubernetes.io/name=humio -c humio -f | grep DataSnapshotLoader
Expected log sequence:
Checking bucket storage
localAndHttpWereEmpty=trueTrying to fetch a global snapshot as recovery source from bucket storage
Fetched a global snapshot as recovery source
updateSnapshotForDisasterRecovery: Patching regionupdateSnapshotForDisasterRecovery: Patching bucket
Step 5j: Leave the
AZURE_RECOVER_FROM_* env vars in place - do NOT
remove them manually. While LogScale is running they are inert
(only consulted during cold start). Removing them would trigger an
operator pod replacement - which kills all pods simultaneously - and
LogScale would lose recovered data if it hasn't yet written its
first snapshot to storage (typically 10-20 minutes after startup). The
next terraform apply on the primary workspace will
remove them cleanly.
Phase 4 - Secondary Cleanup (run after verifying primary is healthy)
This phase resets the secondary cluster's Kafka state and global snapshots so it can return to standby mode and serve as a failover target again. Until Phase 4 is complete, the secondary is not ready for another failover event - its Kafka offsets and snapshot data are stale from the previous failover and would cause errors if the operator were scaled up again.
Important
Run this phase only after confirming the primary is fully healthy. Cleaning the secondary while the primary is still recovering could leave you with no cluster to fall back to.
Step 1 (pre-flight): Verify primary health:
curl -sk https://<primary-fqdn>/api/v1/status
# Must return HTTP 200
Steps 2-4: Scale down secondary LogScale and Kafka:
kubectl --context aks-secondary -n logging scale deploy humio-operator --replicas=0
kubectl --context aks-secondary -n logging delete pods \
  -l app.kubernetes.io/name=humio --ignore-not-found=true

# Wait for LogScale pods to fully terminate
kubectl --context aks-secondary -n logging \
  wait --for=delete pod -l app.kubernetes.io/name=humio --timeout=180s

kubectl --context aks-secondary -n logging scale deploy strimzi-cluster-operator --replicas=0
kubectl --context aks-secondary -n logging delete pods \
  -l strimzi.io/cluster --force --grace-period=0 --ignore-not-found=true

# Wait for Kafka pods to fully terminate
kubectl --context aks-secondary -n logging \
  wait --for=delete pod -l strimzi.io/cluster --timeout=180s
Steps 5-6: Delete Kafka PVCs and StrimziPodSets to fully reset Kafka state:
kubectl --context aks-secondary -n logging delete pvc -l strimzi.io/cluster --ignore-not-found=true
kubectl --context aks-secondary -n logging delete strimzipodset --all --ignore-not-found=true

# Wait for PVCs to be fully deleted (may take 30-60 seconds for Azure Disk detach)
while kubectl --context aks-secondary -n logging get pvc -l strimzi.io/cluster 2>/dev/null | grep -q .; do
  echo "Waiting for PVCs to be deleted..."
  sleep 10
done
echo "PVCs deleted"
Step 7: Restore Strimzi and wait for Kafka to become ready:
kubectl --context aks-secondary -n logging scale deploy strimzi-cluster-operator --replicas=1
# Wait for Kafka pods to become Running/Ready
kubectl --context aks-secondary -n logging \
  wait pod -l strimzi.io/component-type=kafka --for=condition=Ready --timeout=300s
Step 8: Reset the secondary Kafka
global-events topic to prevent
OffsetOutOfRangeException when LogScale loads
a fresh snapshot that references Kafka offsets from the primary cluster.
The script spawns a temporary admin pod (to avoid OOM inside the Kafka container), mounts the cluster CA cert, builds a PKCS12 truststore, and connects via TLS on port 9093 to delete the topic. See Phase 3 Step 5g for the full breakdown of key steps.
./test/reset-kafka-topic.sh --context aks-secondaryStep 9: Delete secondary global snapshots from Azure Storage. Only snapshot blobs are deleted - data segments must be preserved. After reverse recovery, the primary's recovered snapshot references the secondary's data segments for searching historical data that was ingested while the primary was failed over. Deleting those segments would cause search failures for the failover time window.
# Switch to secondary workspace first (terraform workspace select outputs a message to stdout
# that would corrupt a variable if combined with terraform output in the same subshell)
terraform workspace select secondary
SECONDARY_PREFIX=$(terraform output -raw AZURE_STORAGE_OBJECT_KEY_PREFIX)

# Get the storage account key for authentication
STORAGE_KEY=$(az storage account keys list \
  --account-name <secondary-storage-account> --query '[0].value' -o tsv)

az storage blob delete-batch \
  --account-name <secondary-storage-account> \
  --account-key "$STORAGE_KEY" \
  --source <secondary-storage-container> \
  --pattern "${SECONDARY_PREFIX}globalsnapshots/*"
Private endpoint restriction: If the storage account firewall blocks external access, this command will fail with a 403. See the note in Phase 3 Step 5e for workarounds (in-cluster pods or temporary firewall exception).
Phase 5 - Final Verification and Alert Re-enablement
Step 1: Verify the global DR FQDN returns HTTP 200:
curl -sk https://<global-dr-fqdn>/api/v1/status
# Expected: HTTP 200
Steps 2-4: Re-enable the DR failover alert and verify stability:
az monitor metrics alert update \
  --name "$DR_ALERT_NAME" \
  --resource-group "$SECONDARY_RG" \
  --enabled true

# Wait 30 seconds and verify the alert does not immediately re-fire
sleep 30
az rest --method get \
  --uri "https://management.azure.com/subscriptions/${SUB_ID}/providers/Microsoft.AlertsManagement/alerts?api-version=2019-05-05-preview" \
  -o json | jq --arg name "$DR_ALERT_NAME" '
  [.value[] |
   select(.properties.essentials.monitorCondition == "Fired") |
   select(.properties.essentials.alertState != "Closed") |
   select(.properties.essentials.alertRule | test($name + "$"))] | length'
# Expected: 0
Warning: Do not run terraform apply on
the primary state during an active failover - this would re-enable the
Traffic Manager endpoint and bypass failback prevention. Running it
after failback (when the primary is already serving traffic) is safe and
will also clean up the AZURE_RECOVER_FROM_* env vars
left by Phase 3.
AZURE_RECOVER_FROM_* Environment Variable Preservation
When promoting a standby cluster (dr="standby" →
dr="active"), the AZURE_RECOVER_FROM_*
environment variables are removed, which may trigger a pod restart. Plan
for a restart window during promotion.
For details on the Terraform logic, verification commands, and operational implications, see Environment Variables.
Failover Timing Summary
Production: ~9-12 minutes end-to-end (detection → function → service ready).
Testing: ~5-9 minutes end-to-end (with immediate failover settings).
Key knobs:
dr_failover_function_pre_failover_failure_seconds
(holdoff delay, default 180s),
traffic_manager_health_check_interval (probe
frequency, default 30s),
traffic_manager_tolerated_failures (failures before
unhealthy, default 3).
For the full timing breakdown (per-phase durations), configuration variables table, holdoff mechanism, and testing vs production settings, see Failover Timing Reference.