
Dashboards
LogScale dashboards provide real-time visualization of log data. You can create multiple dashboards to monitor different aspects of your systems. Dashboards are composed of widgets that you create based on frequently used searches, to view server activities in the form of various graphs and tables of relevant data.
Figure 167, “LogScale Dashboard” shows an example dashboard:
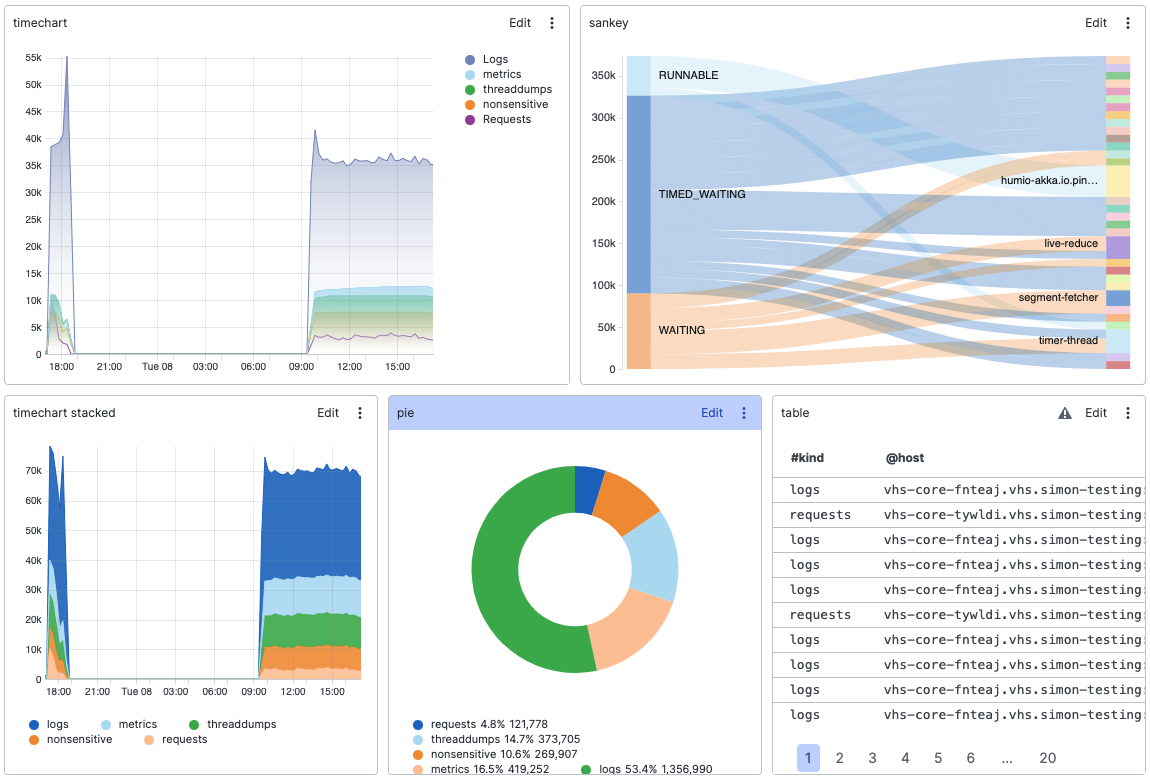 |
Figure 167. LogScale Dashboard
Learn about dashboards in the Step-by-Step Guide to Dashboards.