


Top Endpoints by Error Count
Count error-level log events per service and endpoint to rank endpoints by the number of errors they produce. Useful for triaging production incidents by identifying which endpoints are generating the most errors at a glance.
Visualization: the table displays one row per unique service and endpoint combination, with:
endpoint column showing the API endpoint path
service column showing the service name
_count column showing the number of error events, sorted descending and color-shaded by threshold
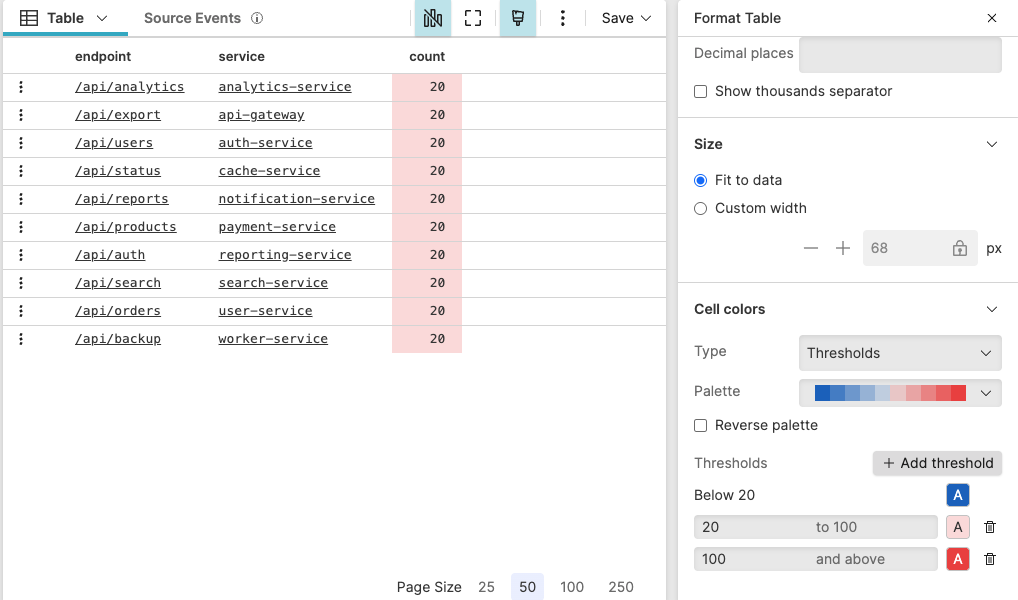 |
Figure 257. Top Endpoints by Error Count
Sample input data:
| @timestamp | endpoint | error | host | level | service |
|---|---|---|---|---|---|
| 1970-01-01T00:00:02 | /api/orders | Connection timeout after 30s | svc-01 | error | payment-service |
| 1970-01-01T00:00:02 | /api/auth | Authentication token expired | svc-02 | error | auth-service |
| 1970-01-01T00:00:02 | /api/orders | Database query failed | svc-01 | error | payment-service |
| 1970-01-01T00:00:02 | /api/reports | Memory limit exceeded | svc-03 | error | analytics-service |
| 1970-01-01T00:00:02 | /api/auth | Rate limit exceeded | svc-02 | error | auth-service |
Query:
level=error
| groupBy([service, endpoint])
| sort(_count, order=desc)
Query breakdown:
Filters events to include only those where the level field equals
error.Groups the filtered events by the unique combination of service and endpoint, counting occurrences in each group as _count.
Sorts the results by _count in descending order so the highest-error services appear at the top of the table.
Configuration:
From the
Searchpage, type your query in the Query Editor → clickChoose in the Widget selector
Click the style icon : this opens the Format panel on the side where some properties are already configured by default based on the query result.
Click the field service in the Columns section and set Size → .
Click the field _count in the Columns section and set:
Cell colors → → choose a color palette → : shading intensifies as error counts increase, making the highest-error services immediately visible.
To customize this widget further, see Table Property Reference.