


HTTP Error Summary by Method and Status
Count HTTP error events per method and status code combination to
identify which HTTP methods produce the most errors. Useful for
triaging API failures and spotting patterns such as a high rate of
404 errors on
GET requests or
400 errors on
POST requests.
Visualization: the table displays one row per unique method and status code combination, with:
method column showing the HTTP method (GET, POST, DELETE, and so on)
status column showing the HTTP status code
_count column showing event count with threshold-based color shading
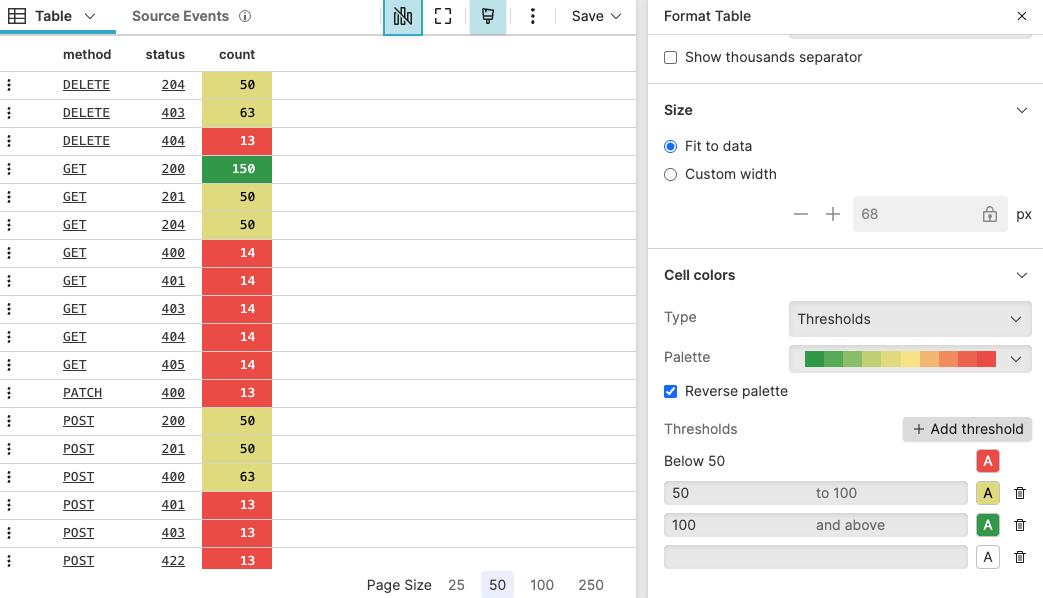 |
Figure 256. HTTP Error Summary by Method and Status
Sample input data:
| @timestamp | endpoint | host | method | status |
|---|---|---|---|---|
| 1970-01-01T00:00:02 | /api/users | web-01 | GET | 404 |
| 1970-01-01T00:00:02 | /api/orders | web-02 | POST | 400 |
| 1970-01-01T00:00:02 | /api/reports | web-01 | DELETE | 403 |
| 1970-01-01T00:00:02 | /api/users | web-03 | PUT | 409 |
| 1970-01-01T00:00:02 | /api/auth | web-02 | GET | 401 |
Query:
groupBy([method, status])Query breakdown:
Groups all events by the unique combination of method and status fields, producing one result row per combination.
Counts the number of events in each group, storing the result in the _count field, which becomes the third column in the table.
Configuration:
From the
Searchpage, type your query in the Query Editor → clickChoose in the Widget selector
Click the style icon : this opens the Format panel on the side where some properties are already configured by default based on the query result.
Modify the properties to obtain the look and feel in this example. Click the field method in the Columns section and set these properties:
Formatting → Show as : creates links to the Event List for each entry in method, to show the corresponding result.
Size →
Click the field _count in the Columns section and set:
Cell colors → → choose a color palette → : different shades highlight different count ranges (below 100, 100 to 1,000, above 1,000, and so on).
To customize this widget further, see Table Property Reference.