


Active Error Count
Show the total number of errors in a system as a single prominent number for at-a-glance monitoring. Useful on an operations dashboard where you want to know immediately whether errors are occurring, without drilling into a chart.
Visualization: the widget displays a
single large number representing the total count of error events in
the selected time window. The Single
Value widget automatically selects the first numeric
field it finds in the query result
(_count in this case) and uses
it as the displayed value:
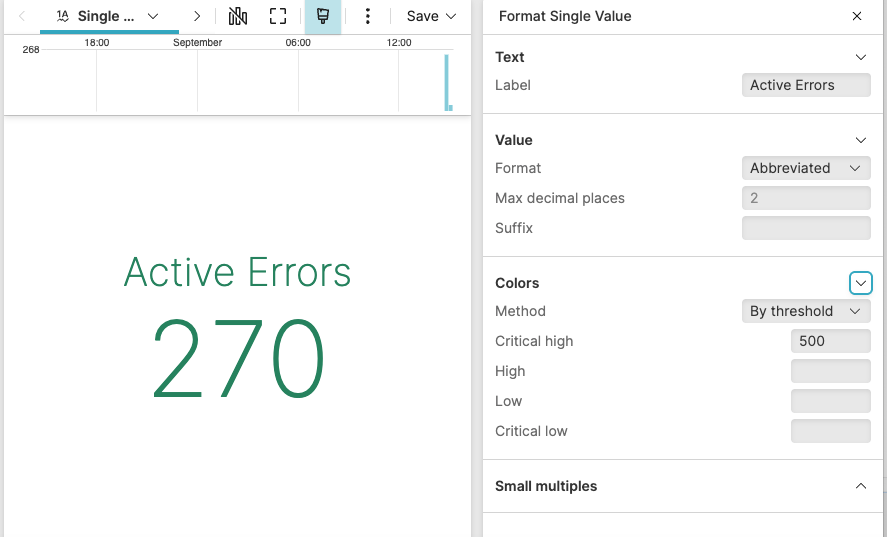 |
Figure 249. Active Error Count
Sample input data:
| @timestamp | host | loglevel | message | service |
|---|---|---|---|---|
| 1970-01-01T00:00:02 | svc-01 | error | Connection timeout after 30s | payment-service |
| 1970-01-01T00:00:02 | svc-02 | error | Authentication token expired | auth-service |
| 1970-01-01T00:00:02 | svc-03 | info | User login successful | user-service |
| 1970-01-01T00:00:02 | svc-04 | error | Memory limit exceeded | analytics-service |
| 1970-01-01T00:00:02 | svc-05 | warn | Cache eviction triggered | cache-service |
Query:
loglevel = /error/i
| count()Query breakdown:
Filters events where the loglevel field matches the pattern
error(case insensitive).Counts all matching events and stores the result in the _count field. This produces a single-row result, which the
Single
          Value
widget uses as the displayed number.
Configuration:
From the
Searchpage, type your query in the Query Editor → clickChoose in the Widget selector
Click the style icon : this opens the Format panel on the side.
In Text, enter a Label such as
Active Errorsto describe the displayed value. Optionally configure Color thresholds to highlight when error counts exceed a critical level.
To customize this widget further, see Single Value Property Reference.