


Ingestion Rate Trend
Show the current ingestion rate — events per hour — as a single value, together with a trend indicator and a sparkline to provide temporal context. Useful on a system health dashboard where you want to know both the current rate and whether it is rising or falling.
Visualization: when the query uses
timeChart(), the widget gains three additional
display modes:
A value — the main central number shows the _count from the last bucket (depending on the Last Bucket property setting, see Single Value Property Reference).
A trend — the difference between the last and first bucket values of _count over the selected time window.
A sparkline — a small area chart below the value that shows how _count has changed over time. Toggle the Sparkline property to show or hide it (see Single Value Property Reference).
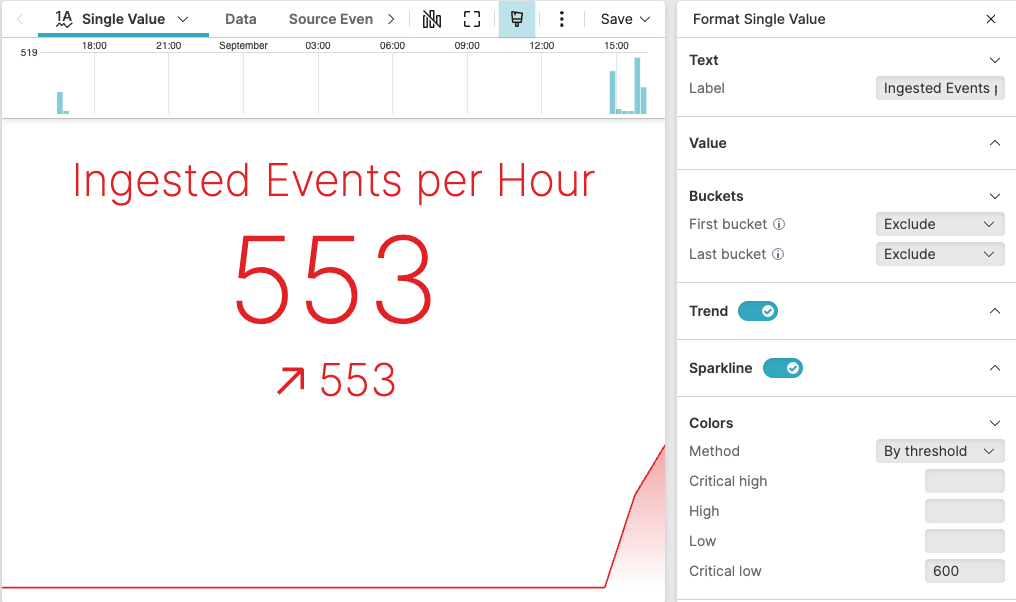 |
Figure 252. Ingestion Rate Trend
Sample input data:
| @timestamp | host | loglevel | message | service |
|---|---|---|---|---|
| 1970-01-01T00:00:02 | svc-01 | info | User login successful | auth-service |
| 1970-01-01T00:00:02 | svc-02 | error | Payment failed | payment-service |
| 1970-01-01T00:00:02 | svc-03 | info | Profile updated | user-service |
| 1970-01-01T00:00:02 | svc-04 | warn | Slow query detected | analytics-service |
| 1970-01-01T00:00:02 | svc-05 | info | Cache refreshed | cache-service |
Query:
timeChart(span=1h)Query breakdown:
Groups all events into one-hour time buckets, producing a result with two fields per bucket: _bucket (the bucket start timestamp) and _count (the number of events ingested in that hour).
The
Single Valuewidget uses the _count from the last bucket as the displayed value, calculates the trend from the difference between first and last bucket, and renders the full time series as a sparkline.
Configuration:
From the
Searchpage, type your query in the Query Editor → clickChoose in the Widget selector
Click the style icon : this opens the Format panel on the side.
Toggle the Trend property on to show the change between the first and last bucket values below the main number.
Toggle the Sparkline property on to show the historical trend area below the value.
In Text, enter a Label such as
Ingested Events per Hourto describe the displayed value.Under Buckets, set First bucket and Last bucket to
Excludeto omit potentially incomplete boundary buckets from the displayed value.Optionally, in Colors, set Method to
By thresholdand configure threshold values to color the value when it exceeds a critical level.
To customize this widget further, see Single Value Property Reference.