


Build Test Failure Count
Extract and display the number of failed tests reported by a build pipeline. Rather than counting individual failure events, this example reads the exact number that the build system already calculated and logged as part of its output.
Visualization: the widget displays
the number of failed tests extracted from the build log. The
max() function aggregates the extracted value
into a single numeric field, so the Single
Value widget knows exactly which value to display:
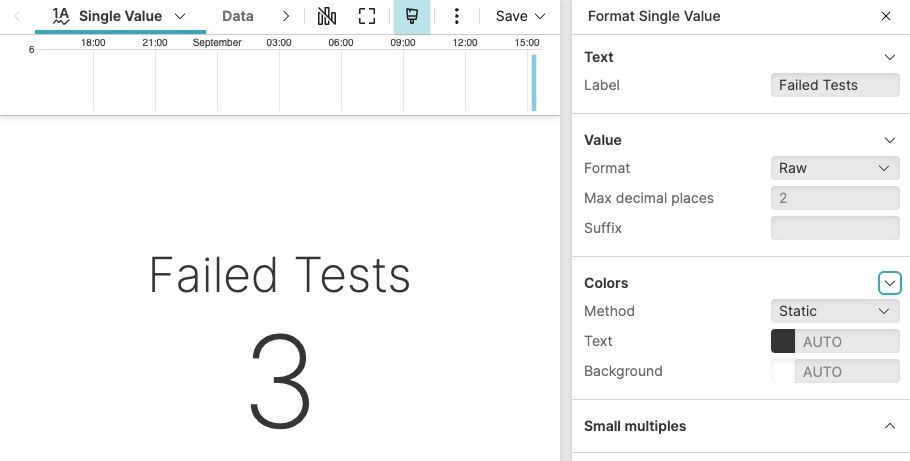 |
Figure 250. Build Test Failure Count
Sample input data:
| @timestamp | commit | host | message | pipeline |
|---|---|---|---|---|
| 1970-01-01T00:00:02 | 67686a1 | build-01 | Build started for commit 67686a1 | ci-build |
| 1970-01-01T00:00:02 | 67686a1 | build-01 | Running test suite: unit | ci-build |
| 1970-01-01T00:00:02 | 67686a1 | build-01 | Tests failed: 3 | ci-build |
| 1970-01-01T00:00:02 | 67686a1 | build-01 | Build complete | ci-build |
Query:
commit = 67686a1
| /Tests failed: (?<tests_failed>\d+)/
| max(tests_failed, as=tests_failed)
Query breakdown:
Filters events for the specific commit
67686a1, assuming one build per commit.Extracts the number of failed tests from the log message using a regex capture group, storing the result in the tests_failed field.
Uses
max()to aggregate the tests_failed values across all matching events, returning the highest value as a numeric field. Because the build always reports the same count, this produces a single numeric result that theSingle Valuewidget can display.
Configuration:
From the
Searchpage, type your query in the Query Editor → clickChoose in the Widget selector
Click the style icon : this opens the Format panel on the side.
In Text, enter a Label such as
Failed Teststo describe the displayed value.
To customize this widget further, see Single Value Property Reference.