Skip to content
LogoLogScale DocumentationLibraryGuidance Release Notes Integrations Query Examples Training APIGraphQLSearch Archives Contact Support
๐Ÿ”– ๐Ÿ”” เฉ†Help button for documentation
    • Getting Data Out
    • Manage Repositories and Views
      • Create Repository or View
      • Repository and View Settings
      • Falcon LTR Repositories
      • Delete a Repository or View
    • Search Data
      • Query Editor
      • Event Fields
      • Display Fields
      • Manage Fields
      • Display Results and Events
      • Inspect Events
      • Copy Rows
      • Look Up Events
      • Show in Context
      • Format Columns
      • Column Properties
      • Field Data Types
      • Field Interactions
      • Choose Visualization
      • Highlight Filter Match
      • Change Time Interval
      • Set Time Zone
      • Save Results
      • Export Data
      • Search Status
      • Event List Interactions
      • Field Aliasing
        • Configuring Field Aliasing
        • Managing Field Aliasing
        • Searching with Field Aliasing
        • Understanding Field Mapping Requirements
        • Understanding Schema Requirements
    • Data Visualization
      • Dashboards
        • Step-by-Step Guide to Dashboards
        • Create Dashboards
        • Optimize Dashboard Performance with Persisted Aggregations
        • Manage Dashboards
        • Customize Dashboards
        • Design the Dashboard Layout
          • Dashboard Sections
        • Work with Time on Dashboards
          • Shared Time Selector
          • Widget Time Selector
          • Section Time Selector
          • Live Dashboards
          • Time Zone Settings
          • Default Time Settings for Dashboards
        • Make your Dashboard Interactive
          • Apply Dashboard Filters
          • Work with Dashboard Parameters
          • Work with Dashboard Interactions
        • Share Dashboards
          • Disabling Access to Shared Dashboards
          • Restricting Access with IP Filters
        • Export Dashboards as PDF
          • PDF Export Options
      • Widgets
        • Create Widgets
        • Manage Widgets
          • Hint: Deselect Series in Widgets
          • Limitation: Widgets with Live join() Functions
          • Hint: Embedding iFrame Widgets
        • Widget Gallery
        • Bar Chart Widget
          • Bar Chart Usage and Data Format
          • Bar Chart Examples Gallery
            • Event Detection Across Severity Levels
            • Failed and Successful Authentication Attempts
            • Threat Type Distribution
            • Alert Type Proportion in Detection Sources
            • Detection Counts with Severity Average
          • Bar Chart Property Reference
        • Event List Widget
          • Event List Usage and Data Format
          • Event List Property Reference
        • Gauge Widget
          • Gauge Usage and Data Format
          • Gauge Examples Gallery
            • Display Number of Errors
            • Display Query Memory
            • Display Small Multiple Charts
          • Gauge Property Reference
        • Heat Map Widget
          • Heat Map Usage and Data Format
          • Heat Map Examples Gallery
            • Github Push Events
            • Response Time
          • Heat Map Property Reference
        • Note Widget
            • Note Widget Property Reference
        • Parameter Panel Widget
        • Pie Chart Widget
          • Pie Chart Usage and Data Format
          • Pie Chart Examples Gallery
            • Distribution of Security Alert Severities
            • Authentication Methods Distribution
            • Malware Types by Infection Count (In Small Multiples)
            • Network Traffic by Protocol
          • Pie Chart Property Reference
        • Sankey Diagram Widget
          • Sankey Usage and Data Format
          • Sankey Examples Gallery
            • Network Traffic
            • Thread Usage
          • Sankey Property Reference
        • Scatter Chart Widget
          • Usage and Data Format
          • Scatter Chart Property Reference
        • Single Value Widget
          • Single Value Usage and Data Format
          • Single Value Examples Gallery
            • Displaying Number of Errors
            • Displaying Statistics from a Build
            • Displaying a Non-Numeric Value
            • Displaying a Trend with a Timechart
            • Displaying Values in a Grid
          • Single Value Property Reference
        • Table Widget
          • Table Usage and Data Format
          • Table Widget Interactions
          • Table Widget Examples Gallery
            • Display Different Statuses
            • Add Temporary Events and URLs
          • Table Property Reference
        • Time Chart Widget
          • Time Chart Usage and Data Format
          • Time Chart Examples Gallery
            • Charting Metric Data
            • Charting Log Levels
            • Charting Commits in GitHub
          • Time Chart Property Reference
        • World Map Widget
          • World Map Usage and Data Format
          • World Map Examples Gallery
            • IP-Based Geographic Distribution
            • Service Performance Monitoring
            • Geohash Performance Clustering
          • World Map Property Reference
    • Automation
      • Triggers
        • What Trigger Type to Choose
        • General Information About Triggers
        • Trigger Management
          • Create Triggers
          • Edit Triggers
          • Manage Triggers
        • Trigger Properties
          • General Properties
          • Configuration Properties
          • Actions Properties
          • Advanced Settings
          • Scheduled Search Properties
        • Monitor, Diagnose, and Troubleshoot Triggers
          • Monitor Triggers with humio-activity Repository
          • Aggregate Alert Errors and Solutions
          • Scheduled Search Errors and Solutions
          • Filter Alert Errors and Solutions
          • Legacy Alert Errors and Solutions
          • Errors when Using Live join() Functions
      • Actions
        • Create Actions
        • Manage Actions
        • Action Type: Email
        • Action Type: Falcon LogScale Repository
        • Action Type: OpsGenie
        • Action Type: PagerDuty
        • Action Type: S3
        • Action Type: Slack
        • Action Type: Lookup File
        • Action Type: VictorOps (Splunk On-Call)
        • Action Type: Webhooks
        • Send aggregate results to actions
        • Message Templates and Variables
      • Schedule PDF Reports
        • Scheduled Reports Security
          • Create a Scheduled PDF Role using the web interface
        • Managing Scheduled Reports
        • Create Scheduled Reports
        • Edit Scheduled Reports
        • Scheduled Report Operation and Limitations
        • Scheduled Report Errors and Resolutions
      • Persisted Aggregations
        • Persisted Aggregation Management
          • Create Persisted Aggregations
          • Configure Persisted Aggregation Properties
            • Scheduling Details
          • Edit Persisted Aggregations
          • Manage Persisted Aggregations
      • Cron Scheduling
    • Template Language
      • Template Expressions
      • Template Variable Types
      • Template Examples
Falcon LogScale Documentation
/ Getting Data Out (GDO)
/ Data Visualization
/ Widgets
Content was updated:Aug 4, 2026

Widget Gallery

The different widget types allow you to display information in different formats. Each widget type has its strengths, and choosing the right one depends on:

  • Type of input data being visualized

  • Number of variables/categories

  • Intended analysis goal

  • Dashboard space constraints

Click on each widget type for more information:
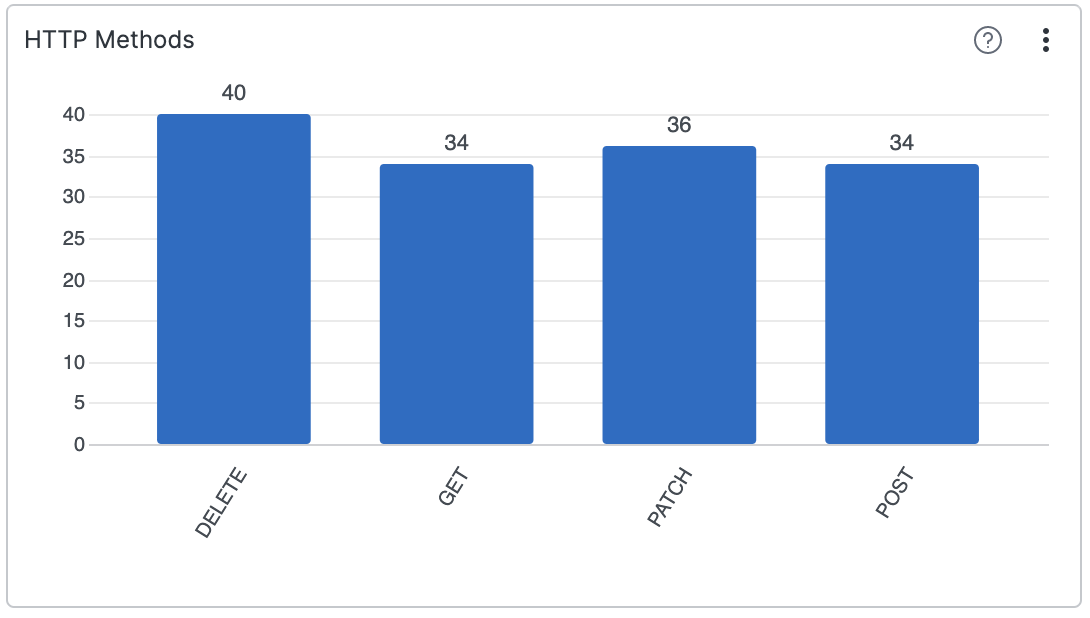
  • Bar Chart Widget

    Visualizes results of the aggregated data โ€” even results with multiple aggregates.
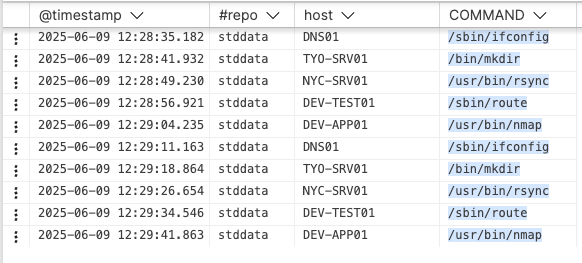
  • Event List Widget

    Displays data entries coming into LogScale. It's the default way to view data.
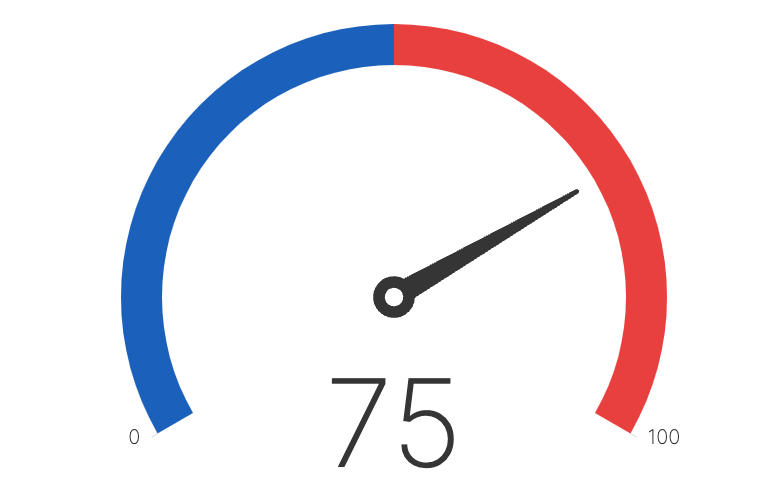
  • Gauge Widget

    Displays a single number, a total for a search result (for instance, number of errors for day). Also supports multiple small charts โ€” one for each field value of the aggregate query.

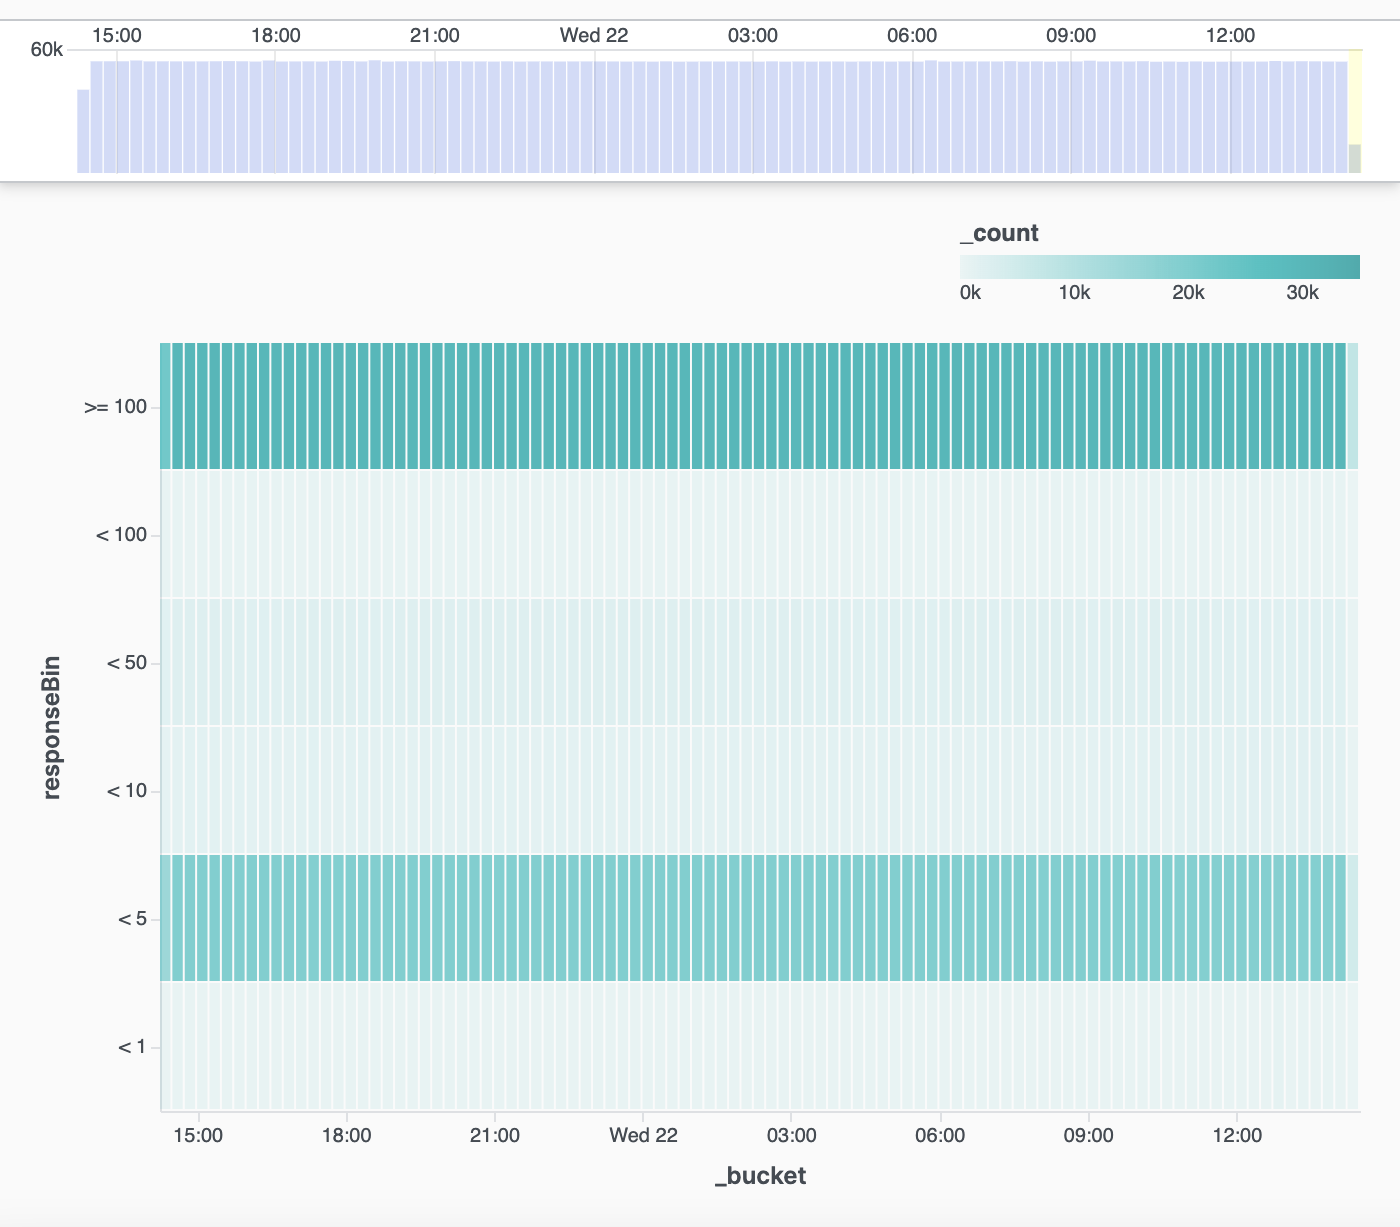
  • Heat Map Widget

    Displays a central variable of interest across two-axis variables.
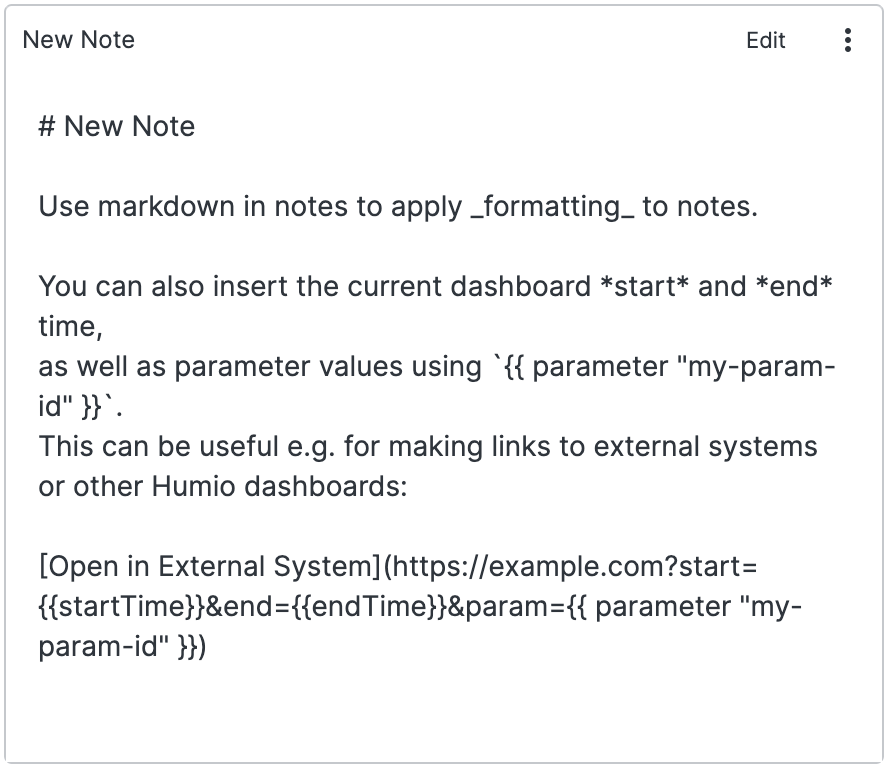
  • Note Widget

    Can contain usage descriptions, user guides, and dynamic links to other systems
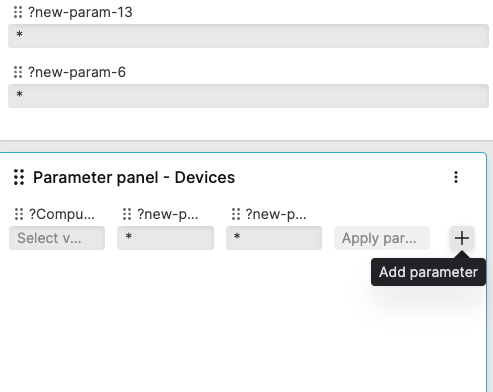
  • Parameter Panel Widget

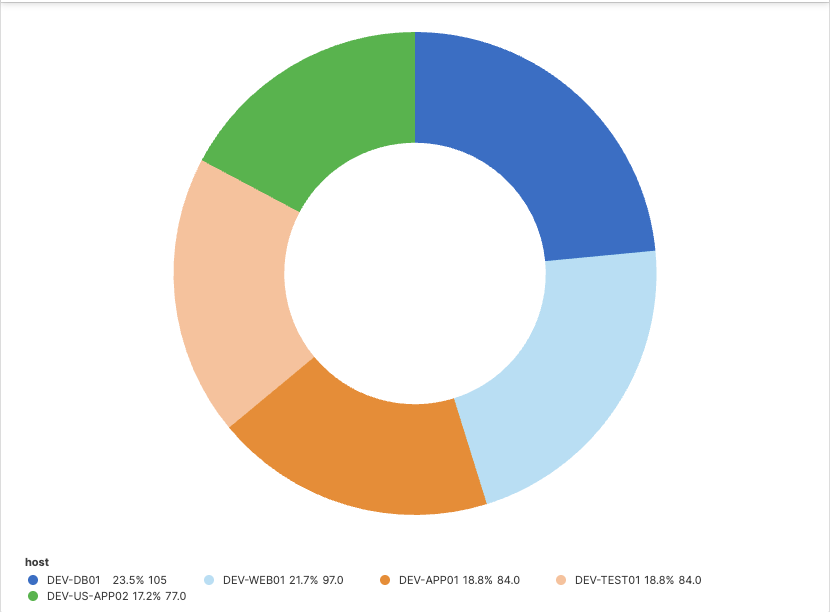
  • Pie Chart Widget

    Views aggregated data and shows a visual image of the data as a whole, and proportionally for each component. When used with aggregate queries that have more than one field, also supports multiple small charts โ€” one for each field value.

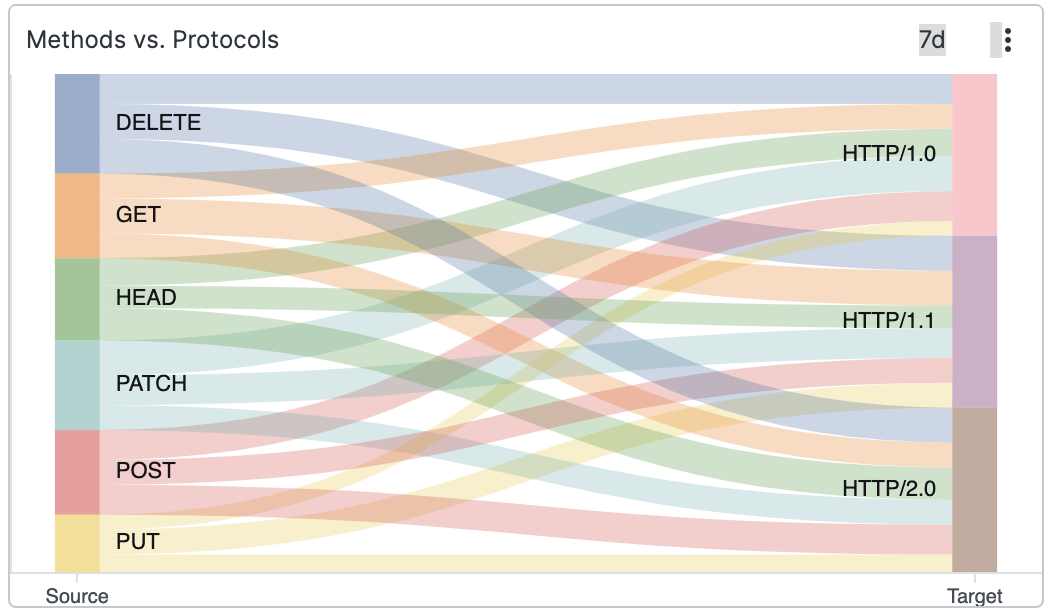
  • Sankey Diagram Widget

    Shows results as a two-level Sankey diagram.
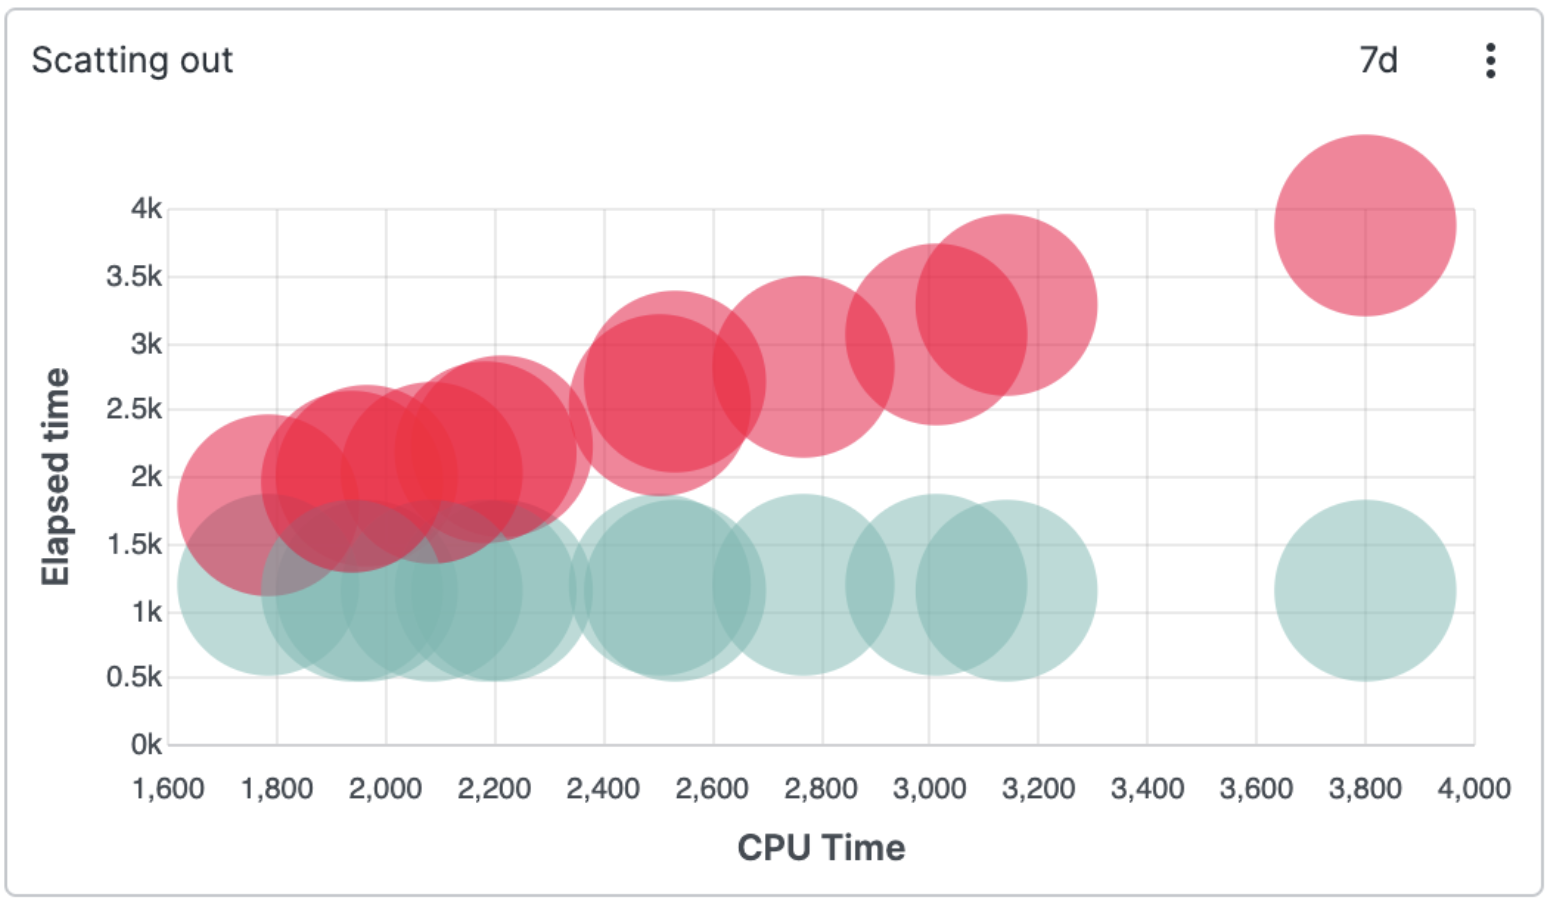
  • Scatter Chart Widget

    Correlates two or more sets of different numerical values.
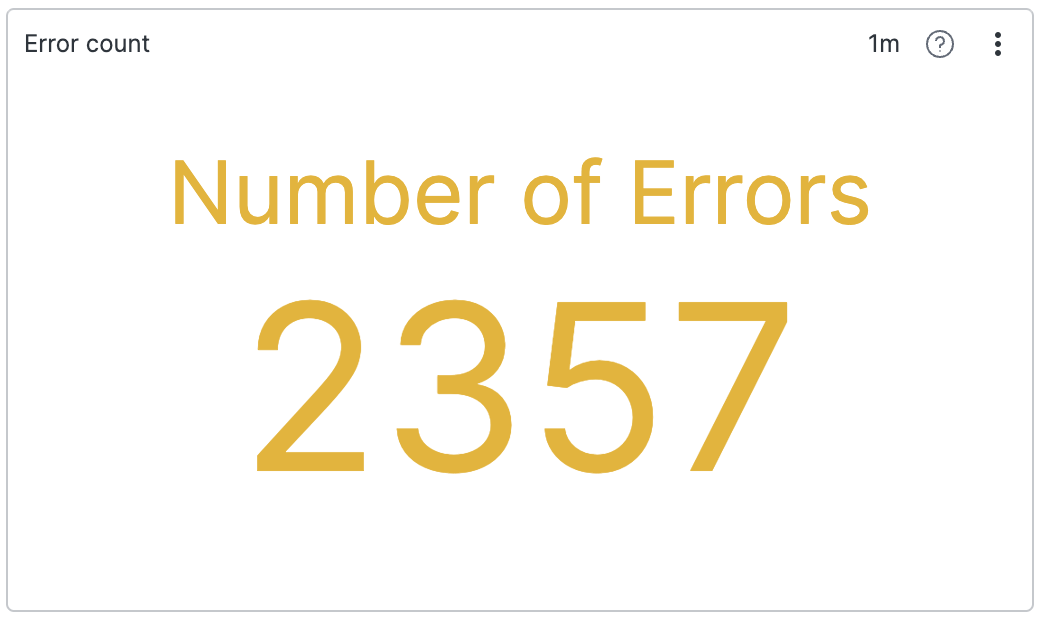
  • Single Value Widget

    Displays a single value as the outcome of a search result, can be a number or a non-numeric value. Also supports small multiple charts โ€” one for each field value of the aggregate query.

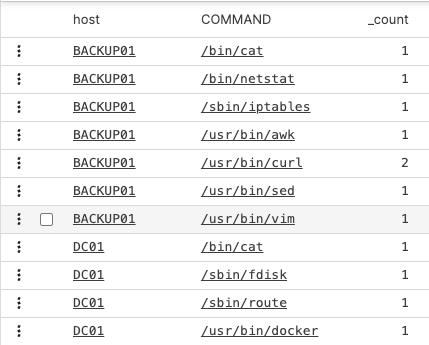
  • Table Widget

    Shows the results of a search in a list with labels or field names and values for each.
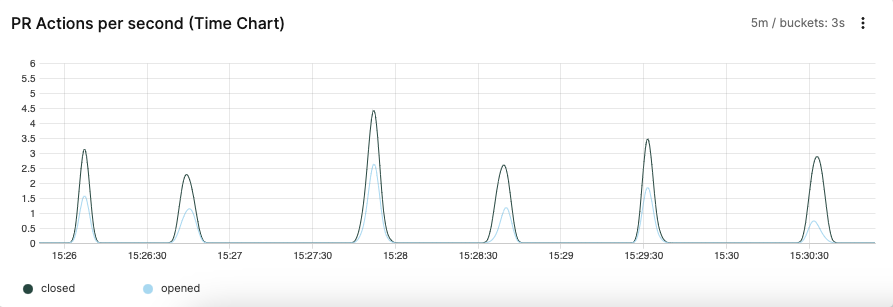
  • Time Chart Widget

    Displays time series data on a timeline. Used most frequently, working with this widget is a good skill to master when first using LogScale.
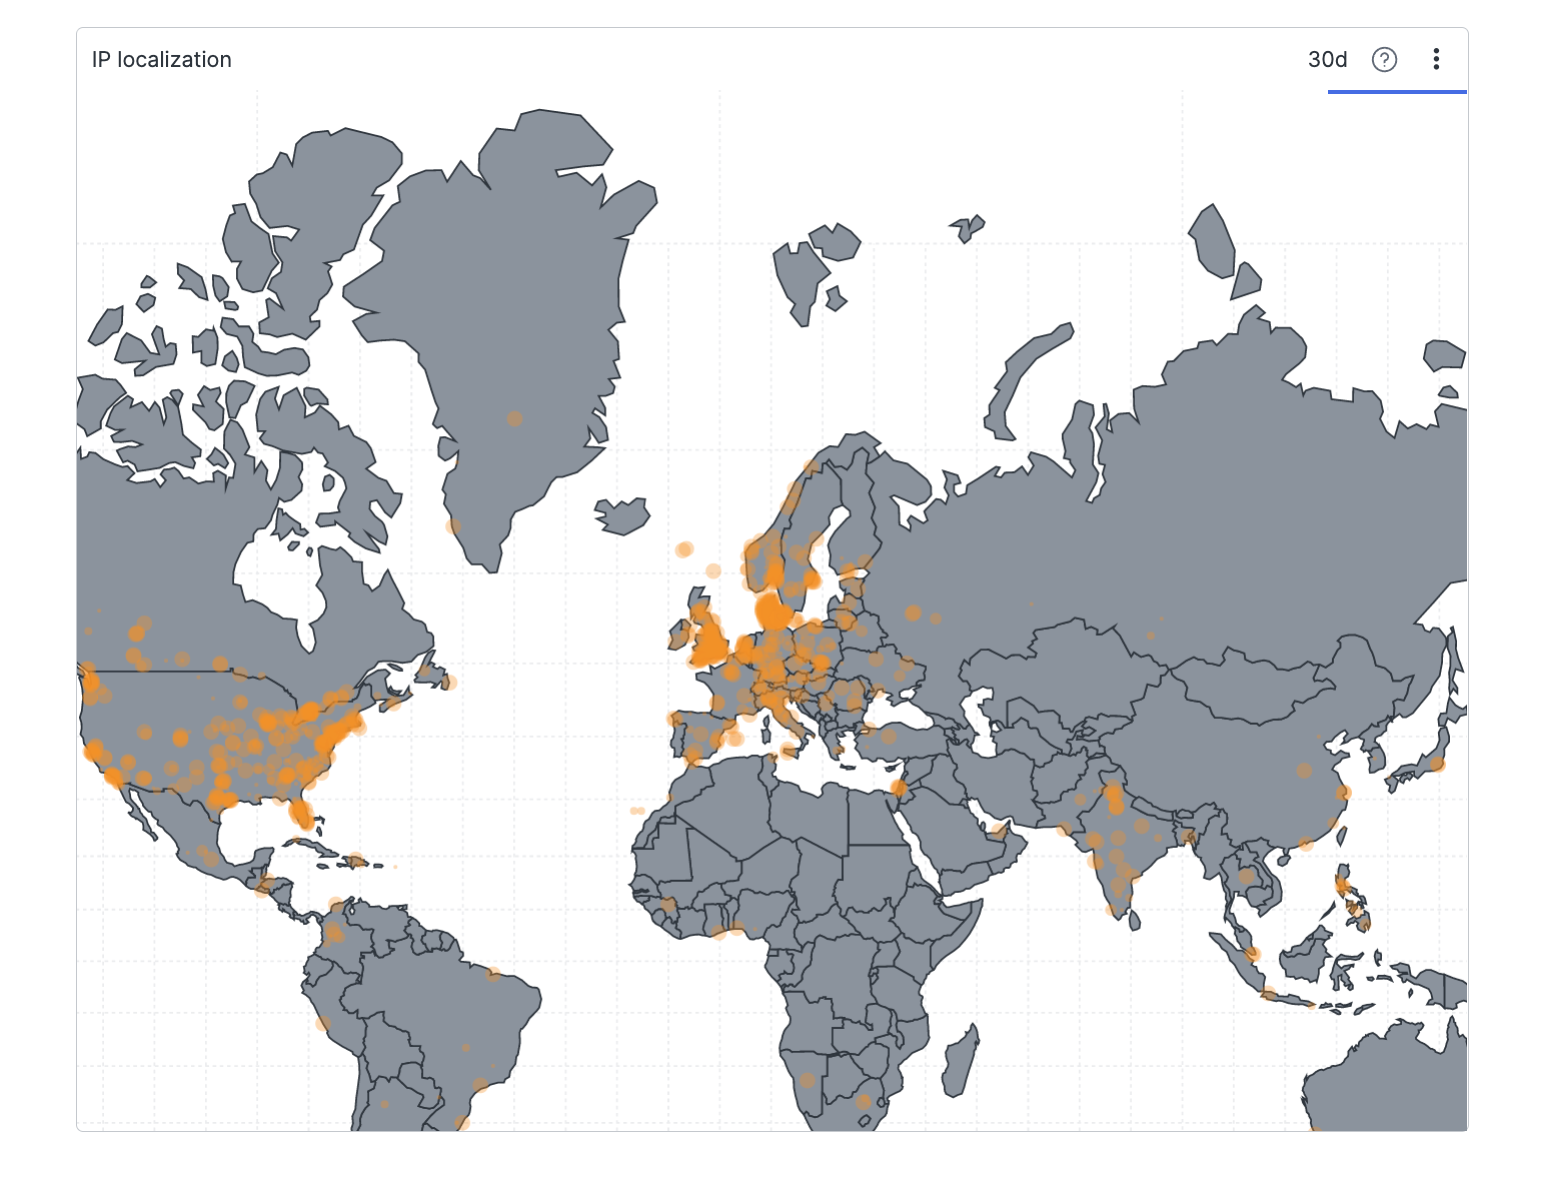
  • World Map Widget

    Displays a map of the world indicating values for each location.

Support
  • Twitter
  • LinkedIn
  • Youtube

ยฉ 2026 CrowdStrike All other marks contained herein are the property of their respective owners.

  • Other articles on this topic

    • Add Temporary Events and URLs
    • Alert Type Proportion in Detection Sources
    • Apply Dashboard Filters
    • Authentication Methods Distribution
    • Bar Chart Examples Gallery
    • Bar Chart Property Reference
    • Bar Chart Usage and Data Format
    • Bar Chart Widget
    • Building Dashboards, Widgets, Charts, and Graphs
    • Charting Commits in GitHub
    • Charting Log Levels
    • Charting Metric Data
    • Create Dashboards
    • Create Widgets
    • Customize Dashboards
    • Dashboard Best Practices
    • Dashboard Sections
    • Dashboard Widgets
    • Dashboards
    • Data Ingestion Overview
    • Data Visualization
    • Default Time Settings for Dashboards
    • Design the Dashboard Layout
    • Detection Counts with Severity Average
    • Disabling Access to Shared Dashboards
    • Display Different Statuses
    • Display Number of Errors
    • Display Query Memory
    • Display Small Multiple Charts
    • Displaying Number of Errors
    • Displaying Statistics from a Build
    • Displaying Values in a Grid
    • Displaying a Non-Numeric Value
    • Displaying a Trend with a Timechart
    • Distribution of Security Alert Severities
    • Event Detection Across Severity Levels
    • Event List Property Reference
    • Event List Usage and Data Format
    • Event List Widget
    • Export Dashboards as PDF
    • Failed and Successful Authentication Attempts
    • Filter Match Highlighting
    • Gauge Examples Gallery
    • Gauge Property Reference
    • Gauge Usage and Data Format
    • Gauge Widget
    • Geohash Performance Clustering
    • Github Push Events
    • Heat Map Examples Gallery
    • Heat Map Property Reference
    • Heat Map Usage and Data Format
    • Heat Map Widget
    • Hint: Deselect Series in Widgets
    • Hint: Embedding iFrame Widgets
    • IP-Based Geographic Distribution
    • Instance Sizing
    • Limitation: Widgets with Live join() Functions
    • Live Dashboards
    • Make your Dashboard Interactive
    • Malware Types by Infection Count (In Small Multiples)
    • Manage Dashboards
    • Manage Widgets
    • Naming and Informational Notes
    • Network Traffic
    • Network Traffic by Protocol
    • Note Widget
    • Note Widget Property Reference
    • PDF Export Options
    • Parameter Panel Widget
    • Pie Chart Examples Gallery
    • Pie Chart Property Reference
    • Pie Chart Usage and Data Format
    • Pie Chart Widget
    • Response Time
    • Restricting Access with IP Filters
    • Sankey Diagram Widget
    • Sankey Examples Gallery
    • Sankey Property Reference
    • Sankey Usage and Data Format
    • Scatter Chart Property Reference
    • Scatter Chart Widget
    • Searching with Field Aliasing
    • Section Time Selector
    • Service Performance Monitoring
    • Share Dashboards
    • Shared Time Selector
    • Single Value Examples Gallery
    • Single Value Property Reference
    • Single Value Usage and Data Format
    • Single Value Widget
    • Step-by-Step Guide to Dashboards
    • Table Property Reference
    • Table Usage and Data Format
    • Table Widget
    • Table Widget Examples Gallery
    • Table Widget Interactions
    • Template Expressions
    • Template Variable Types
    • Thread Usage
    • Threat Type Distribution
    • Time Chart Examples Gallery
    • Time Chart Property Reference
    • Time Chart Usage and Data Format
    • Time Chart Widget
    • Time Zone Settings
    • Usage and Data Format
    • Using Lookup Files
    • Using the match() Function
    • Widget Gallery
    • Widget Time Selector
    • Widgets
    • Work with Dashboard Interactions
    • Work with Dashboard Parameters
    • Work with Time on Dashboards
    • World Map Examples Gallery
    • World Map Property Reference
    • World Map Usage and Data Format
    • World Map Widget
  • Similar Content

    • Add Temporary Events and URLs
    • Alert Type Proportion in Detection Sources
    • Apply Dashboard Filters
    • Authentication Methods Distribution
    • Bar Chart Examples Gallery
    • Bar Chart Property Reference
    • Bar Chart Usage and Data Format
    • Bar Chart Widget
    • Charting Commits in GitHub
    • Charting Log Levels
    • Charting Metric Data
    • Create Dashboards
    • Create Widgets
    • Customize Dashboards
    • Dashboard Sections
    • Dashboards
    • Data Visualization
    • Default Time Settings for Dashboards
    • Design the Dashboard Layout
    • Detection Counts with Severity Average
    • Disabling Access to Shared Dashboards
    • Display Different Statuses
    • Display Number of Errors
    • Display Query Memory
    • Display Small Multiple Charts
    • Displaying Number of Errors
    • Displaying Statistics from a Build
    • Displaying Values in a Grid
    • Displaying a Non-Numeric Value
    • Displaying a Trend with a Timechart
    • Distribution of Security Alert Severities
    • Event Detection Across Severity Levels
    • Event List Property Reference
    • Event List Usage and Data Format
    • Event List Widget
    • Export Dashboards as PDF
    • Failed and Successful Authentication Attempts
    • Filter Match Highlighting
    • Gauge Examples Gallery
    • Gauge Property Reference
    • Gauge Usage and Data Format
    • Gauge Widget
    • Geohash Performance Clustering
    • Github Push Events
    • Heat Map Examples Gallery
    • Heat Map Property Reference
    • Heat Map Usage and Data Format
    • Heat Map Widget
    • Hint: Deselect Series in Widgets
    • Hint: Embedding iFrame Widgets
    • IP-Based Geographic Distribution
    • Limitation: Widgets with Live join() Functions
    • Live Dashboards
    • Make your Dashboard Interactive
    • Malware Types by Infection Count (In Small Multiples)
    • Manage Dashboards
    • Manage Widgets
    • Network Traffic
    • Network Traffic by Protocol
    • Note Widget
    • Note Widget Property Reference
    • PDF Export Options
    • Parameter Panel Widget
    • Pie Chart Examples Gallery
    • Pie Chart Property Reference
    • Pie Chart Usage and Data Format
    • Pie Chart Widget
    • Response Time
    • Restricting Access with IP Filters
    • Sankey Diagram Widget
    • Sankey Examples Gallery
    • Sankey Property Reference
    • Sankey Usage and Data Format
    • Scatter Chart Property Reference
    • Scatter Chart Widget
    • Searching with Field Aliasing
    • Section Time Selector
    • Service Performance Monitoring
    • Share Dashboards
    • Shared Time Selector
    • Single Value Examples Gallery
    • Single Value Property Reference
    • Single Value Usage and Data Format
    • Single Value Widget
    • Step-by-Step Guide to Dashboards
    • Table Property Reference
    • Table Usage and Data Format
    • Table Widget
    • Table Widget Examples Gallery
    • Table Widget Interactions
    • Template Expressions
    • Template Variable Types
    • Thread Usage
    • Threat Type Distribution
    • Time Chart Examples Gallery
    • Time Chart Property Reference
    • Time Chart Usage and Data Format
    • Time Chart Widget
    • Time Zone Settings
    • Usage and Data Format
    • Widget Time Selector
    • Widgets
    • Work with Dashboard Interactions
    • Work with Dashboard Parameters
    • Work with Time on Dashboards
    • World Map Examples Gallery
    • World Map Property Reference
    • World Map Usage and Data Format
    • World Map Widget
  • Related Language Syntax

    • Function Syntax
    • Function Syntax
    • Time Syntax
    • Time Syntax
    • User Parameters (Variables)
    • User Parameters (Variables)
  • Terminology

    • Dashboard
    • Data Visualization
    • Visualization
    • Widget
  • Related Guidance Articles

    • How-To: Dashboard Design Best Practices and Templates
    • How-To: Selecting Widgets Based on Query Output
    • How-To: Visualizing the Same Query With Different Widgets
  • Security (humio-audit) Events

    • Audit Log Event dashboard.delete
    • Audit Log Event dashboard.update
    • Audit Log Event readonly.dashboard.accessed
    • Audit Log Event readonly.dashboard.update

Enter search term