Queries
The LogScale Query Language (LQL) provides a full set of tools for selecting, filtering, and formatting data. The basic structure of the LQL is similar to the pipe-based processing within the Unix or Linux shell environment. The input to the query is a list of events, selected by a time span. That time span is either explicit, or relative, for example, the last 5 minutes.
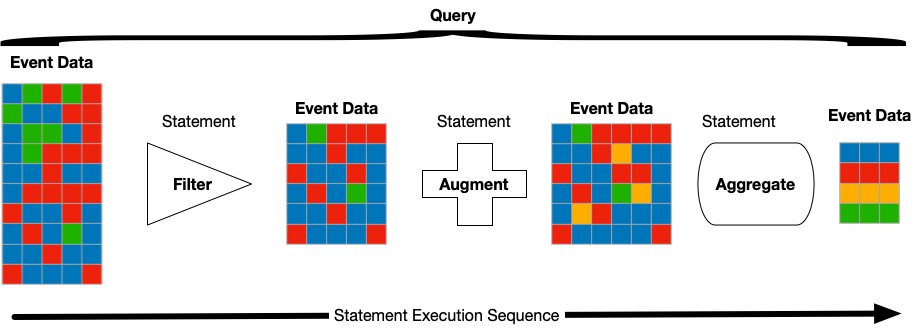
Each set of events is then processed and either filtered, select events from the lists, augmented with additional data or information, or formatted. Formatting can include adding units to numerical values, formatting dates, or aggregated data to provide counts, sums or averages over the data.
 |
For each statement in the query, an event list, consisting of a set of fields, is provided as an input. The query statement performs and action, and then outputs an updated list of events to provide the input for the next statement.
For example, when processing web access logs, you might run the query
url = /.js$/
| groupBy(statuscode)
The first line filters the incoming events, selecting only events where
the requested URL ends in .js (JavaScript files). The
result list of events is then provided as the input to the
groupBy(), which is an aggregate function that
summarizes the data, in this case using the
statuscode. This will take a unique list of the
statuscode values from the set of filtered events and then count the
number of events with that value. The output might look like this:
| statuscode | _count |
|---|---|
| 200 | 288 |
| 304 | 110 |
| 404 | 11 |
Queries are used throughout LogScale to query and access data, including from the internal system repositories used to manage information. Internal usage data, for example, is stored in LogScale and is viewable within the Web UI.
Aggregations
Aggregation expressions are always function calls. These functions can combine their input into a new structure or emit new events into the output stream.
A query becomes an aggregation
query if it uses at least one aggregate function like
sum(), count() or
avg().
For example, the query count() takes a stream of
events as its input, and produces a single record containing a
_count field.
Below are some examples:
loglevel = ERROR
| timechart()x := y * 2
| bucket(function=sum(x))Live Queries
Live queries are executed by LogScale during ingestion and are used to provide 'live' information from the ingested data. Because the data is processed when it is ingested, the results can be returned quicker than if the system waited for the data to be ingested and stored on disk. This is particularly useful in dashboards, but also for built-in alerting system.
When executing a live query, the time interval is always a time window relative to now, for example the last 5 minutes or the last day. Live queries are made up of the historical element and the live element, with the live element directly querying data that is being actively ingested.
Live queries are always being executed if they are being actively or regularly polled for results. This means that results are immediately available when opening a dashboard that is using live queries. If live queries are not polled the server will stop them at some point. The following describes when live queries are stopped:
Live queries on dashboards will be kept running on the server for 3 days if they are not polled.
Live queries are kept running for 1 hour if they are not polled.
All live queries that have not completed their historical search part will be closed if they are not polled for 30 seconds, like historical queries are.
The UI will try to stop live queries, when they are not used anymore. When submitting a new search, the previous one will be stopped.