
percentile() is an estimation function that
estimates percentiles over a given collection of numbers.
| Parameter | Type | Required | Default Value | Description |
|---|---|---|---|---|
accuracy | double | optional[a] | 0.01 | Provided as a relative error threshold. Can be between >0 and <1: values closer to 1 means lower accuracy, values closer to 0 means higher accuracy. |
as | string | optional[a] | Prefix of output fields. | |
field[b] | string | required | Specifies the field for which to calculate percentiles. The field must contain numbers. | |
percentiles | array of numbers | optional[a] | [50, 75, 99] | Specifies which percentiles to calculate. |
[a] Optional parameters use their default value unless explicitly set. | ||||
Hide omitted argument names for this function
Omitted Argument NamesThe argument name for
fieldcan be omitted; the following forms of this function are equivalent:logscale Syntaxpercentile("value")and:
logscale Syntaxpercentile(field="value")These examples show basic structure only.
percentile() Function Operation
A percentile is a comparison value between a particular value and the values of the rest of a group. This enables the identification of scores that a particular score surpassed. For example, with a value of 75 ranked in the 85th percentile, it means that the score 75 is higher than 85% of the values of the entire group. This can be used to determine threshold and limits for triggering events or scoring probabilities and threats.
For example, given the values 12, 25, 50 and 99, the 50th
percentile would be any value between 25 and 50, in this case
the percentile() function will return
25.79. Note that LogScale's percentile function
returns any valid value in order to reduce resource usage and
not the mean of valid values as percentile algorithms in
general often returns.
Note
LogScale uses an approximative algorithm of percentiles in order to achieve a good balance of speed, memory usage and accuracy.
The function returns one event with a field for each of the
percentiles specified in the
percentiles
parameter. Fields are named like by prepending
_ to the values
specified in the
percentiles
parameter. For example the event could contain the fields
_50,
_75 and
_99.
The following conditions apply when using this function:
The function only works on non-negative input values.
The
accuracyargument specifies the accuracy of the percentile relative to the number estimated and is intended as a relative error tolerance (lower values implies a better accuracy). Some examples:An
accuracyof0.001specifies the accuracy of the percentile relative to the number estimated (note that specifying accuracy=0.001 actually implies that the accuracy is 0.999). The number estimated depends on theaccuracyargument and the amount of data available. A larger amount of data returns better estimations.For example, with an original value of 1000 the value would be between 999 and 1001 (
1000-1000/1000and (1000+1000/1000)).An
accuracyof0.01means accuracy to 1/100 of the original value.For example, with an original value of 1000 the value between 990 and 1010 ((
1000-1000/100and (1000+1000/100)).With an original value of 500 the value would be between 495 and 505 ((
500-500/100and500+500/100)).
Any query that does not explicitly set the
accuracyparameter may see a change in the reported percentile. Specifically, thepercentile()function may deviate by up to one 100th of the true percentile, meaning that if a given percentile has a true value of1000, the function may report a percentile in the range of[990; 1010].
Important
Higher
accuracy
implies a high memory usage. Be careful to choose the
accuracy for the kind of precision they need from the
expected output value. Lower percentiles are discarded if
the memory usage becomes too high. If your percentiles seems
off, try reducing the accuracy.
percentile() Syntax Examples
Calculate the 50th,75th,99th and 99.9th percentiles for events with the field responsetime:
percentile(field=responsetime, percentiles=[50, 75, 99, 99.9])In a timechart, calculate percentiles for both of the fields r1 and r2.
timeChart(function=[percentile(field=r1,as=r1),percentile(field=r2,as=r2)])
To calculate the median for a given value, use
percentile() with
percentiles
set to
50:
percentile(field=allocBytes,percentiles=[50],as=median)This creates the field median_50 with the 50th percentile value.
percentile() Examples
Click next to an example below to get the full details.
Calculate Median Memory Allocation
Calculate the median (50th percentile) of memory allocations using
the percentile() function
Query
percentile(field=allocBytes, percentiles=[50], as=median)Introduction
In this example, the percentile() function is used
to calculate the median of memory allocations by setting the 50th
percentile and specifying a custom output field name.
Example incoming data might look like this:
| @timestamp | process_name | allocBytes | thread_id |
|---|---|---|---|
| 2023-06-15T10:00:00Z | java_app | 1024000 | thread-1 |
| 2023-06-15T10:00:01Z | java_app | 1548000 | thread-2 |
| 2023-06-15T10:00:02Z | java_app | 982000 | thread-1 |
| 2023-06-15T10:00:03Z | java_app | 2048000 | thread-3 |
| 2023-06-15T10:00:04Z | java_app | 1126000 | thread-2 |
| 2023-06-15T10:00:05Z | java_app | 1256000 | thread-1 |
| 2023-06-15T10:00:06Z | java_app | 1648000 | thread-3 |
| 2023-06-15T10:00:07Z | java_app | 3072000 | thread-2 |
| 2023-06-15T10:00:08Z | java_app | 1324000 | thread-1 |
| 2023-06-15T10:00:09Z | java_app | 1420000 | thread-3 |
Step-by-Step
Starting with the source repository events.
- logscale
percentile(field=allocBytes, percentiles=[50], as=median)Calculates the median (50th percentile) of the allocBytes field and returns the result in a new field named median_50 (the
_50suffix is automatically added). Event Result set.
Summary and Results
The query is used to find the middle value (median) of memory allocations, providing a representative measure of typical allocation size.
This query is useful, for example, to monitor typical memory usage patterns, establish baseline memory requirements, or detect changes in memory allocation behavior.
Sample output from the incoming example data:
| median_50 |
|---|
| 1420000 |
Note that the output field is automatically named median_50, combining the specified name with the percentile value.
Calculate Multiple Response Time Percentiles
Calculate different percentiles for response time measurements
using the percentile() function
Query
percentile(field=responsetime, percentiles=[50, 75, 99, 99.9])Introduction
In this example, the percentile() function is used
to calculate multiple percentiles (50th, 75th, 99th, and 99.9th) of
response times to analyze performance distribution.
Example incoming data might look like this:
| @timestamp | service_name | responsetime | status_code |
|---|---|---|---|
| 2023-06-15T10:00:00Z | api_gateway | 45 | 200 |
| 2023-06-15T10:00:01Z | api_gateway | 62 | 200 |
| 2023-06-15T10:00:02Z | api_gateway | 89 | 200 |
| 2023-06-15T10:00:03Z | api_gateway | 123 | 500 |
| 2023-06-15T10:00:04Z | api_gateway | 234 | 200 |
| 2023-06-15T10:00:05Z | api_gateway | 56 | 200 |
| 2023-06-15T10:00:06Z | api_gateway | 78 | 200 |
| 2023-06-15T10:00:07Z | api_gateway | 345 | 503 |
| 2023-06-15T10:00:08Z | api_gateway | 67 | 200 |
| 2023-06-15T10:00:09Z | api_gateway | 89 | 200 |
Step-by-Step
Starting with the source repository events.
- logscale
percentile(field=responsetime, percentiles=[50, 75, 99, 99.9])Calculates four different percentiles of the responsetime field:
50th percentile (median)
75th percentile (third quartile)
99th percentile (common SLA threshold)
99.9th percentile (extreme outlier threshold)
The
percentile()function returns the results in new fields named _50, _75, _99, and _99.9.You can rename the output fields using the
asparameter. If the string ispercentile(field=responsetime, as=responsetime, percentiles=[50, 75, 99, 99.9]), thenas=responsetimerenames the fields to responsetime_50, responsetime_75, responsetime_99, and responsetime_99.9. Event Result set.
Summary and Results
The query is used to analyze the distribution of response times and identify performance thresholds.
This query is useful, for example, to establish SLA thresholds, identify performance bottlenecks, or monitor service performance over time.
Sample output from the incoming example data:
| _50 | _75 | _99 | _99.9 |
|---|---|---|---|
| 78 | 123 | 345 | 345 |
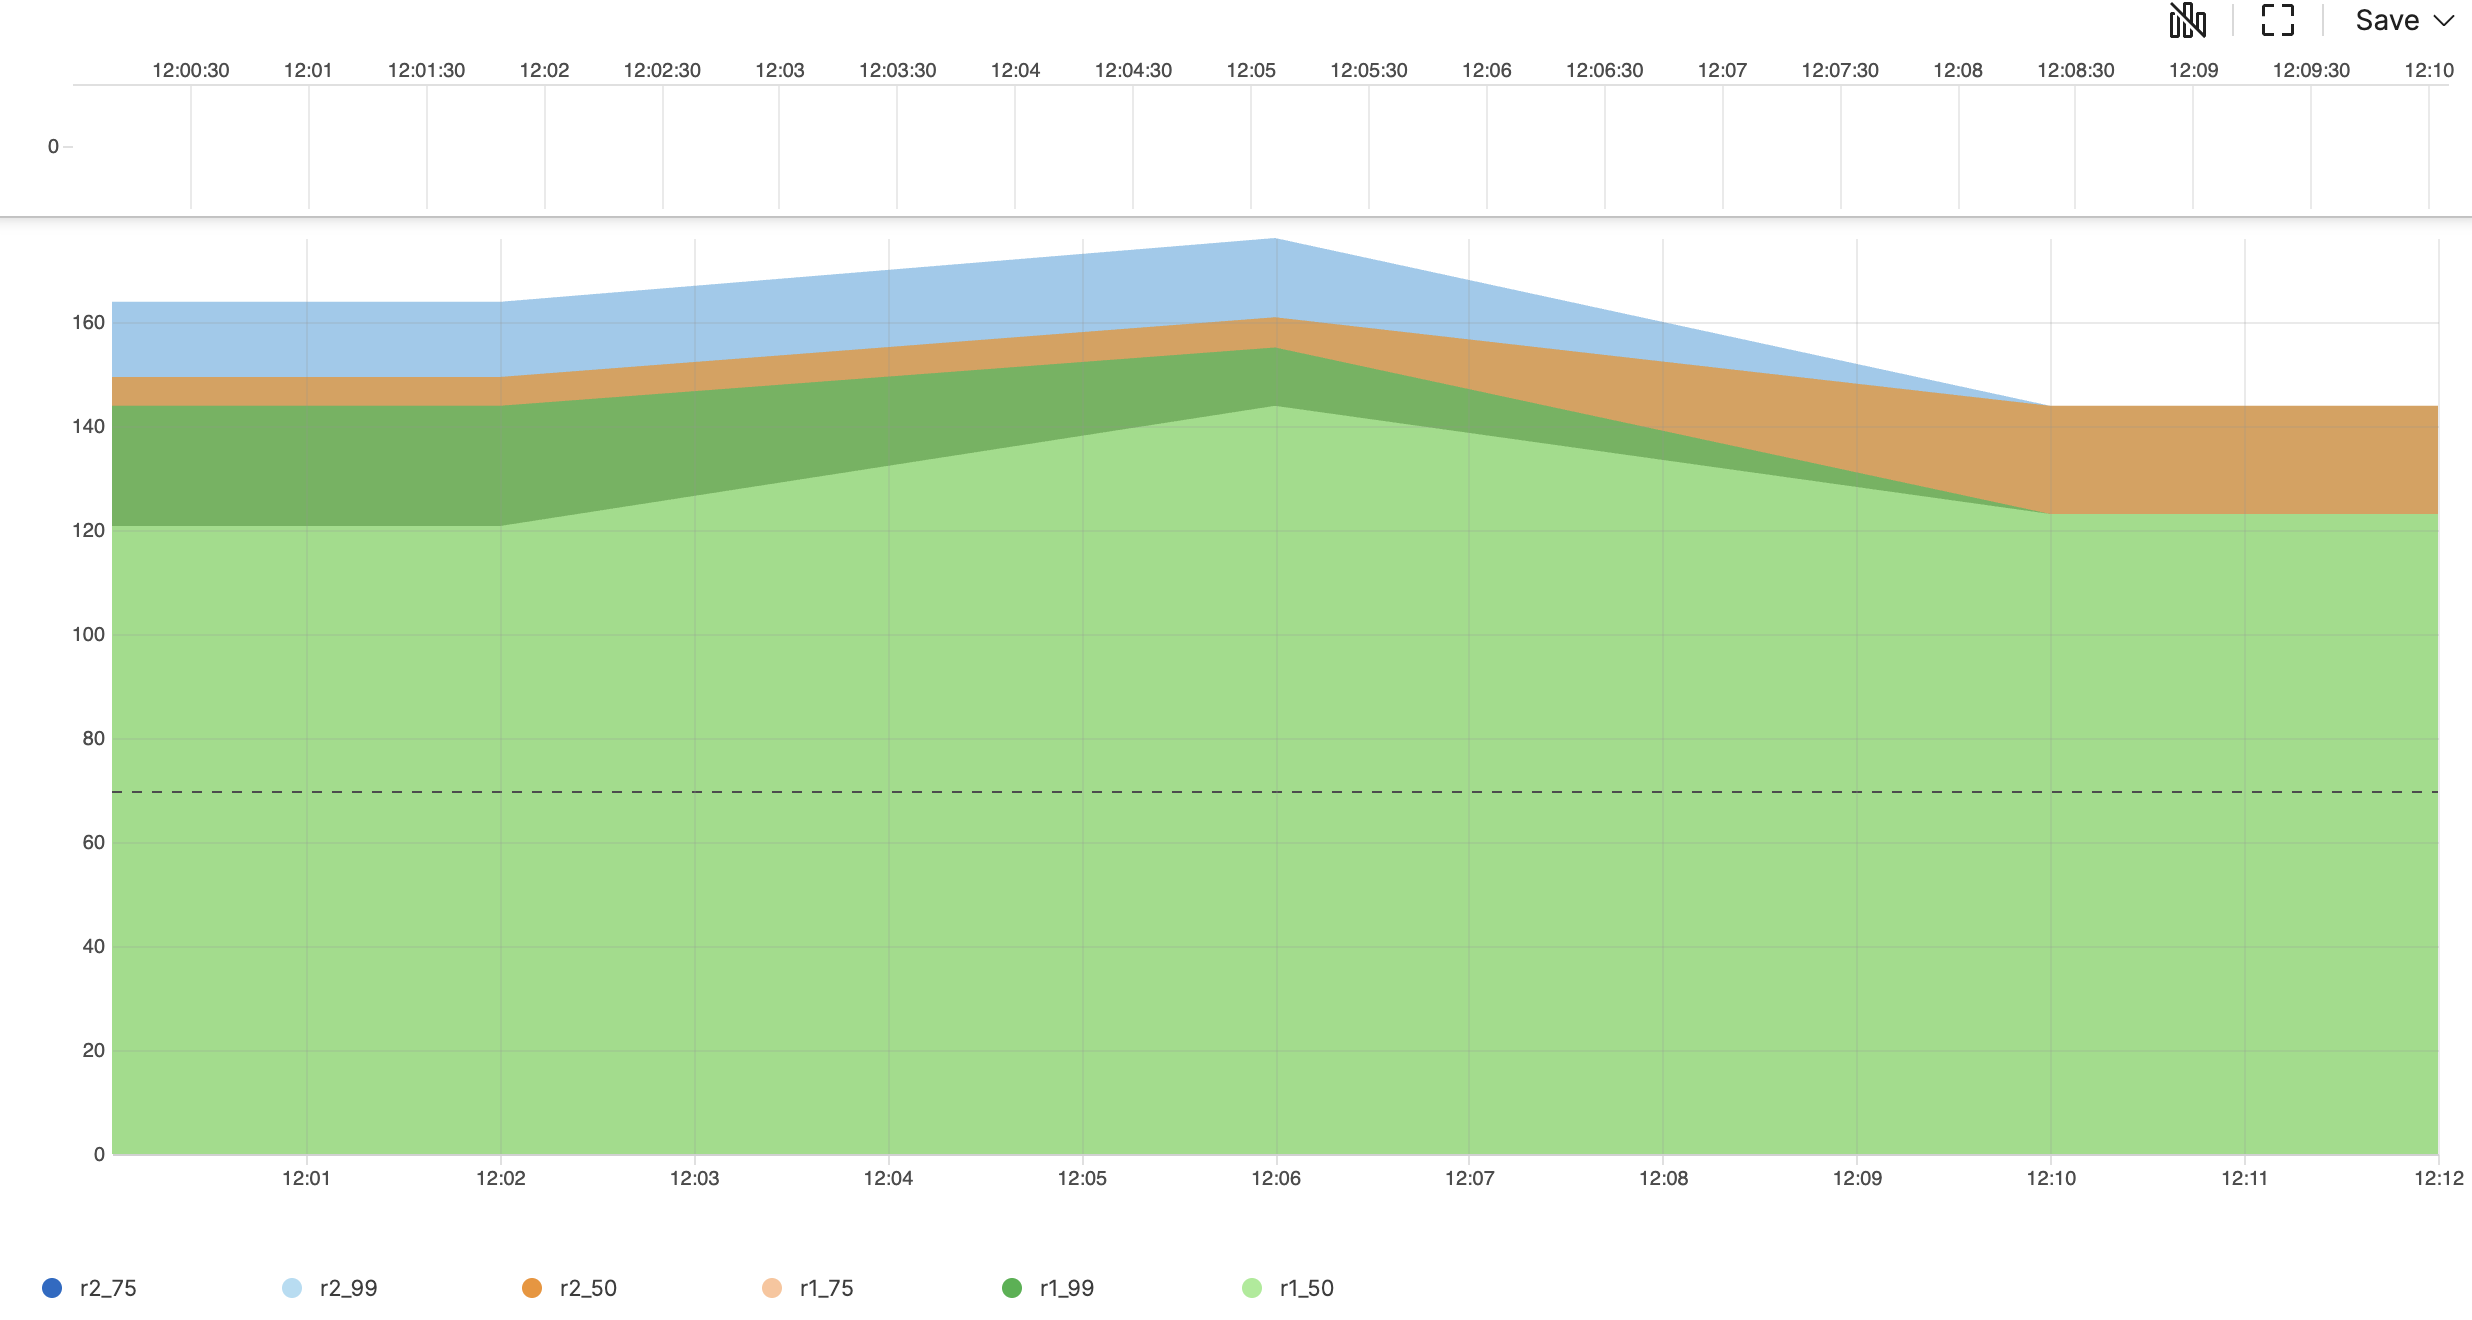
Create Time Chart With Default Percentiles For Multiple Fields
Visualize default percentiles (50th, 75th, 99th) of two metrics
over time using the percentile() function
with timeChart()
Query
timeChart(function=[percentile(field=r1,as=r1),percentile(field=r2,as=r2)], span=4m)Introduction
In this example, the timeChart() function combines
with two percentile() calculations to track the
distribution of two different metrics
(r1 and
r2) over time.
Note that when percentile() is used without
specifying percentiles, it automatically calculates three default
percentiles (50th, 75th, and 99th) for the given field.
Example incoming data might look like this:
| @timestamp | service | r1 | r2 | status |
|---|---|---|---|---|
| 2023-06-15T10:00:00Z | service_a | 120 | 150 | ok |
| 2023-06-15T10:01:00Z | service_a | 145 | 165 | ok |
| 2023-06-15T10:02:00Z | service_a | 98 | 110 | ok |
| 2023-06-15T10:03:00Z | service_a | 167 | 190 | error |
| 2023-06-15T10:04:00Z | service_a | 134 | 155 | ok |
| 2023-06-15T10:05:00Z | service_a | 178 | 195 | ok |
| 2023-06-15T10:06:00Z | service_a | 143 | 160 | ok |
| 2023-06-15T10:07:00Z | service_a | 156 | 175 | ok |
| 2023-06-15T10:08:00Z | service_a | 289 | 310 | error |
| 2023-06-15T10:09:00Z | service_a | 123 | 145 | ok |
Step-by-Step
Starting with the source repository events.
- logscale
timeChart(function=[percentile(field=r1,as=r1),percentile(field=r2,as=r2)], span=4m)Creates a time chart with timespan of 4 minutes per bucket showing three percentile values for each field:
For field r1, creates:
r1_50 (median)
r1_75 (third quartile)
r1_99 (99th percentile)
For field r2, creates:
r2_50 (median)
r2_75 (third quartile)
r2_99 (99th percentile)
The
spanparameter is used to define the timespan of the bucket. Event Result set.
Summary and Results
The query produces a time series showing the distribution of both
metrics using three different percentile thresholds, allowing for
comprehensive performance analysis. When percentiles are not explicitly
specified, the percentile() function automatically
calculates three default percentiles (50th, 75th, and 95th).
This query is useful for comparing typical (median) performance between two metrics, identifying performance variations using the 75th percentile and monitoring extreme outliers with the 99th percentile
Sample output from the incoming example data:
| _bucket | r1_50 | r1_75 | r1_99 | r2_50 | r2_75 | r2_99 |
|---|---|---|---|---|---|---|
| 1.68682E+12 | 120.80792246242098 | 143.93947040702542 | 143.93947040702542 | 149.4847016559383 | 163.94784285493662 | 163.94784285493662 |
| 1.68682E+12 | 143.93947040702542 | 155.16205054702775 | 155.16205054702775 | 160.9814359681496 | 176.22889949490784 | 176.22889949490784 |
| 1.68682E+12 | 123.13088804780689 | 123.13088804780689 | 123.13088804780689 | 143.93947040702542 | 143.93947040702542 | 143.93947040702542 |
Note that the different buckets contain six different percentile values, three for each metric. The 99th percentile captures the extreme values in the data, making it useful for identifying outliers and performance anomalies.
 |
Determine a Score Based on Field Value
Convert percentile rankings to symbol indicators using the
if() and percentile()
functions
Query
percentile(filesize, percentiles=[40,80],as=score)
| symbol := if(filesize > score_80, then=":+1:", else=if(filesize > score_40, then="so-so", else=":-1:"))
Introduction
When summarizing and displaying data, it may be necessary to
derive a score or validity based on a test value. This can be
achieved using if() by creating the score
value if the underlying field is over a threshold value.
Step-by-Step
Starting with the source repository events.
- logscale
percentile(filesize, percentiles=[40,80],as=score)Calculates the
percentile()for the filesize field and determines what filesize that is above 40% of the overall event set, and 80% of the overall event set. - logscale
| symbol := if(filesize > score_80, then=":+1:", else=if(filesize > score_40, then="so-so", else=":-1:"))Compares whether the filesize is greater than 80% of the events, setting symbol to
:+1:. Becauseif()functions can be embedded, theelseparameter is anotherif()statement that sets symbol toso-soif the size is greater than 40%, or:+1:otherwise. Event Result set.
Summary and Results
Using if() is the best way to make conditional
choices about values. The function has the benefit of being able to be
embedded into other statements, unlike
case.
Show Percentiles Across Multiple Buckets
Response time distribution analysis by minute using the
bucket() function with
percentile()
Query
bucket(span=60sec, function=percentile(field=responsetime, percentiles=[50, 75, 99, 99.9]))Introduction
Show response time percentiles over time. Calculate percentiles per minute by bucketing into 1 minute intervals:
Step-by-Step
Starting with the source repository events.
- logscale
bucket(span=60sec, function=percentile(field=responsetime, percentiles=[50, 75, 99, 99.9]))Using a 60 second timespan for each bucket, displays the
percentile()for the responsetime field. Event Result set.
Summary and Results
The percentile() quantifies values by determining
whether the value is larger than a percentage of the overall values. The
output provides a powerful view of the relative significance of a value.
Combined in this example with bucket(), the query
will generate buckets of data showing the comparative response time for
every 60 seconds.