
Choose Visualization
You can display data with different widgets for different visualization formats such as charts, tables, or diagrams. The Widget Selector allows you to choose the most appropriate widget to effectively present and analyze your data.
From the tab, click on the desired view or repository.
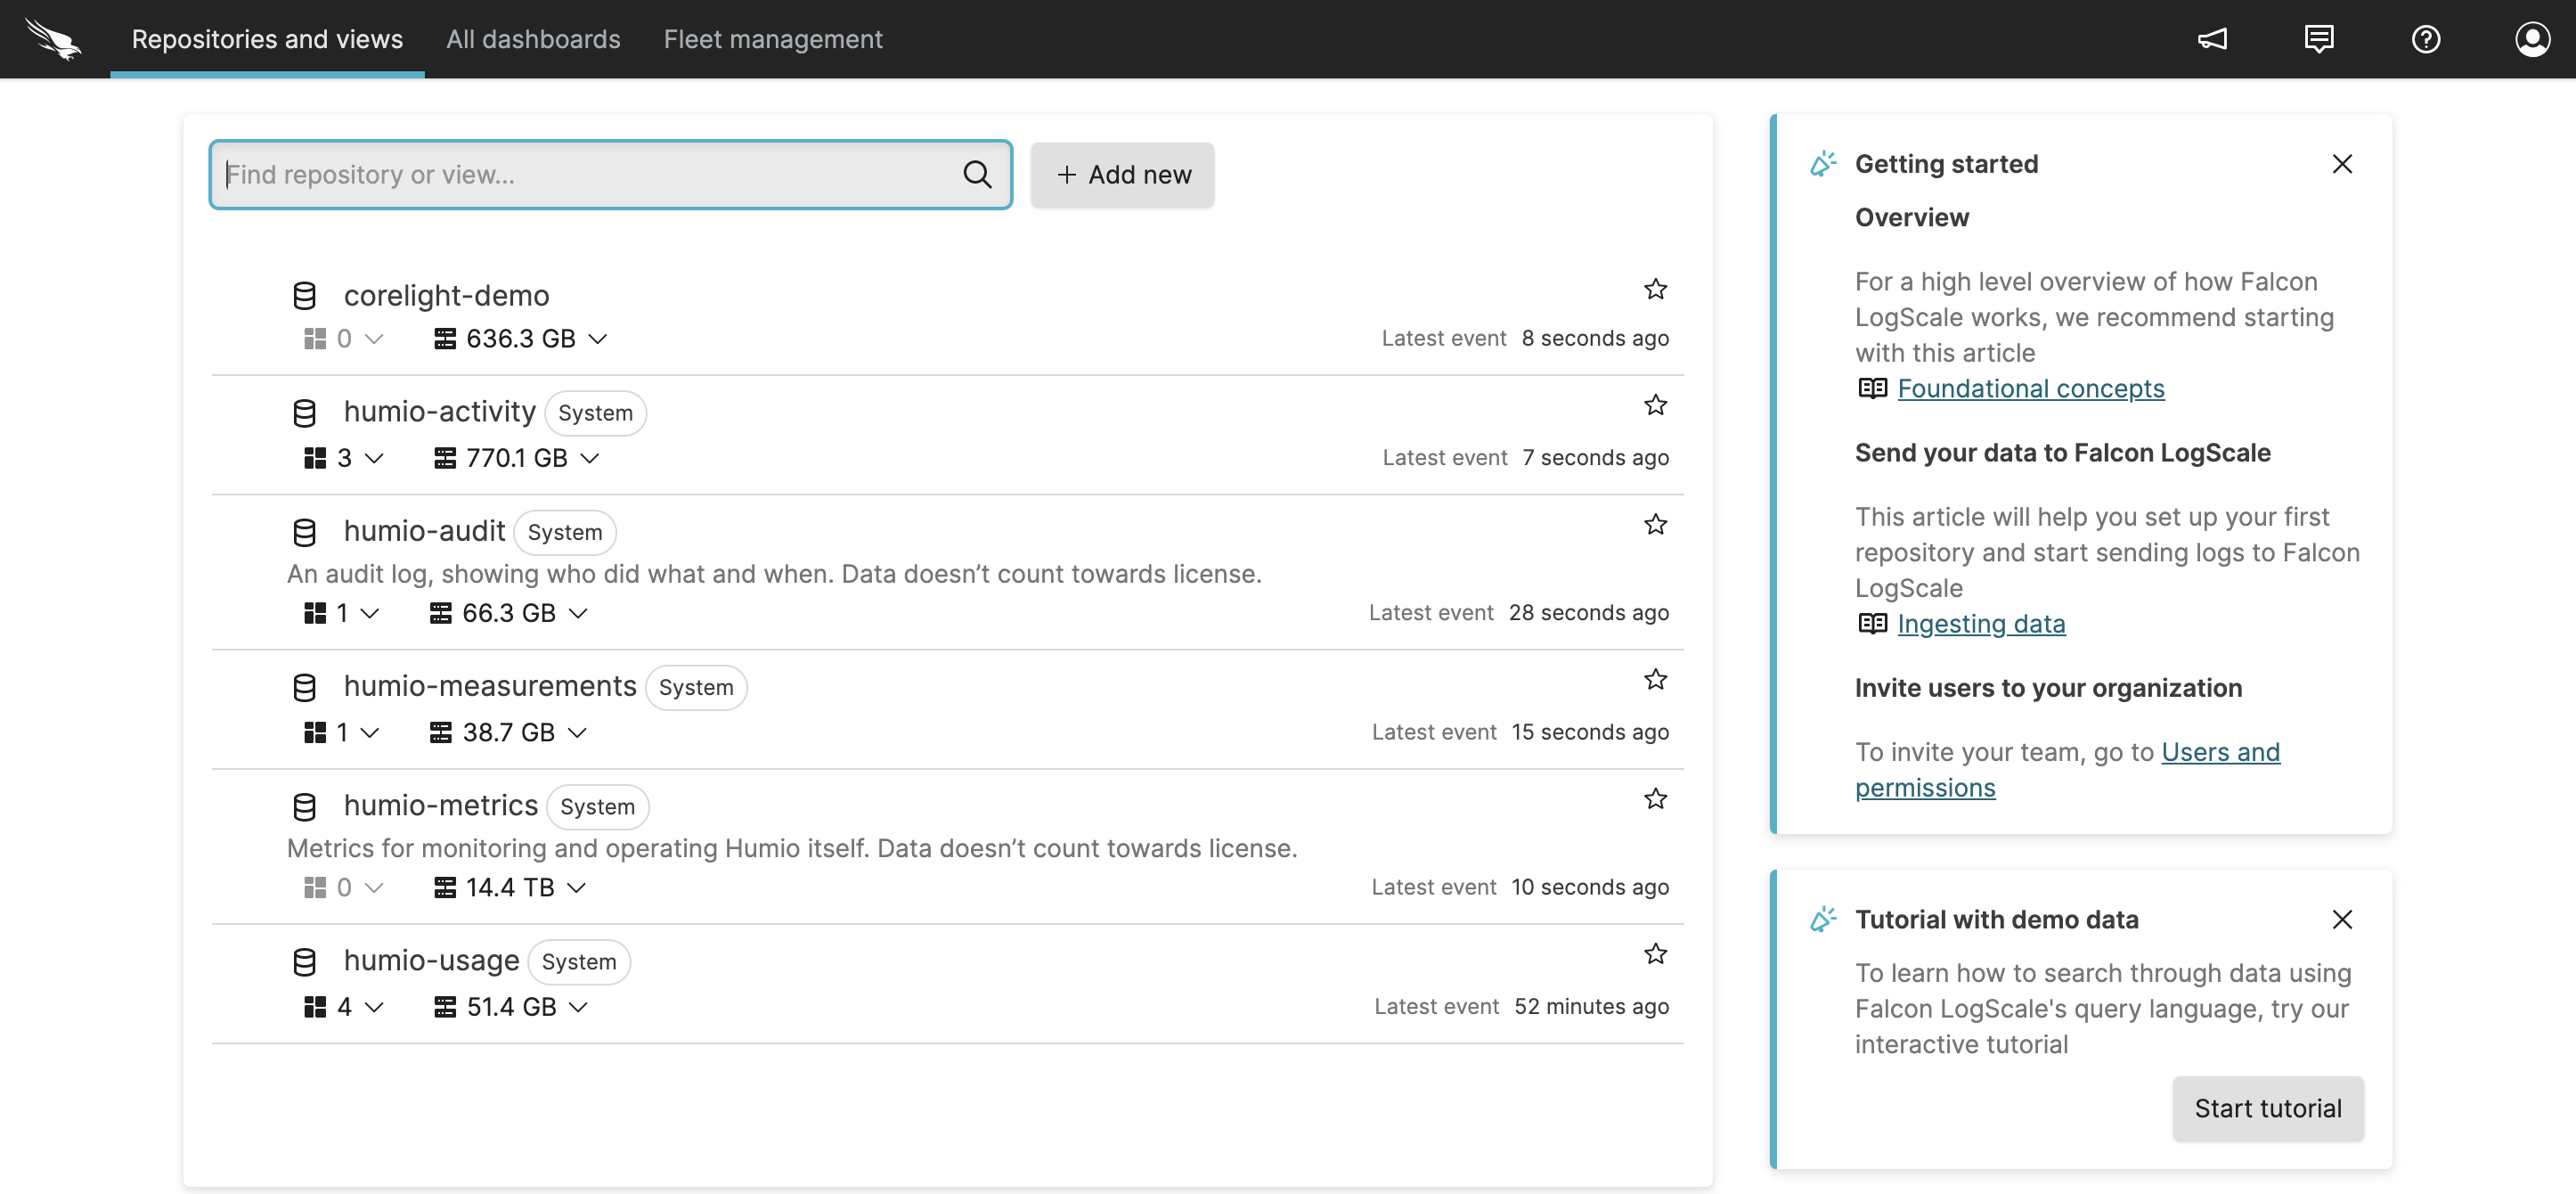
Figure 83. Repositories and Views Page
From the tab, click the
Widget Selectordropdown menu: the default widget is the Event List, which displays your search results in a tabular format. Not all data types are compatible with every visualization widget.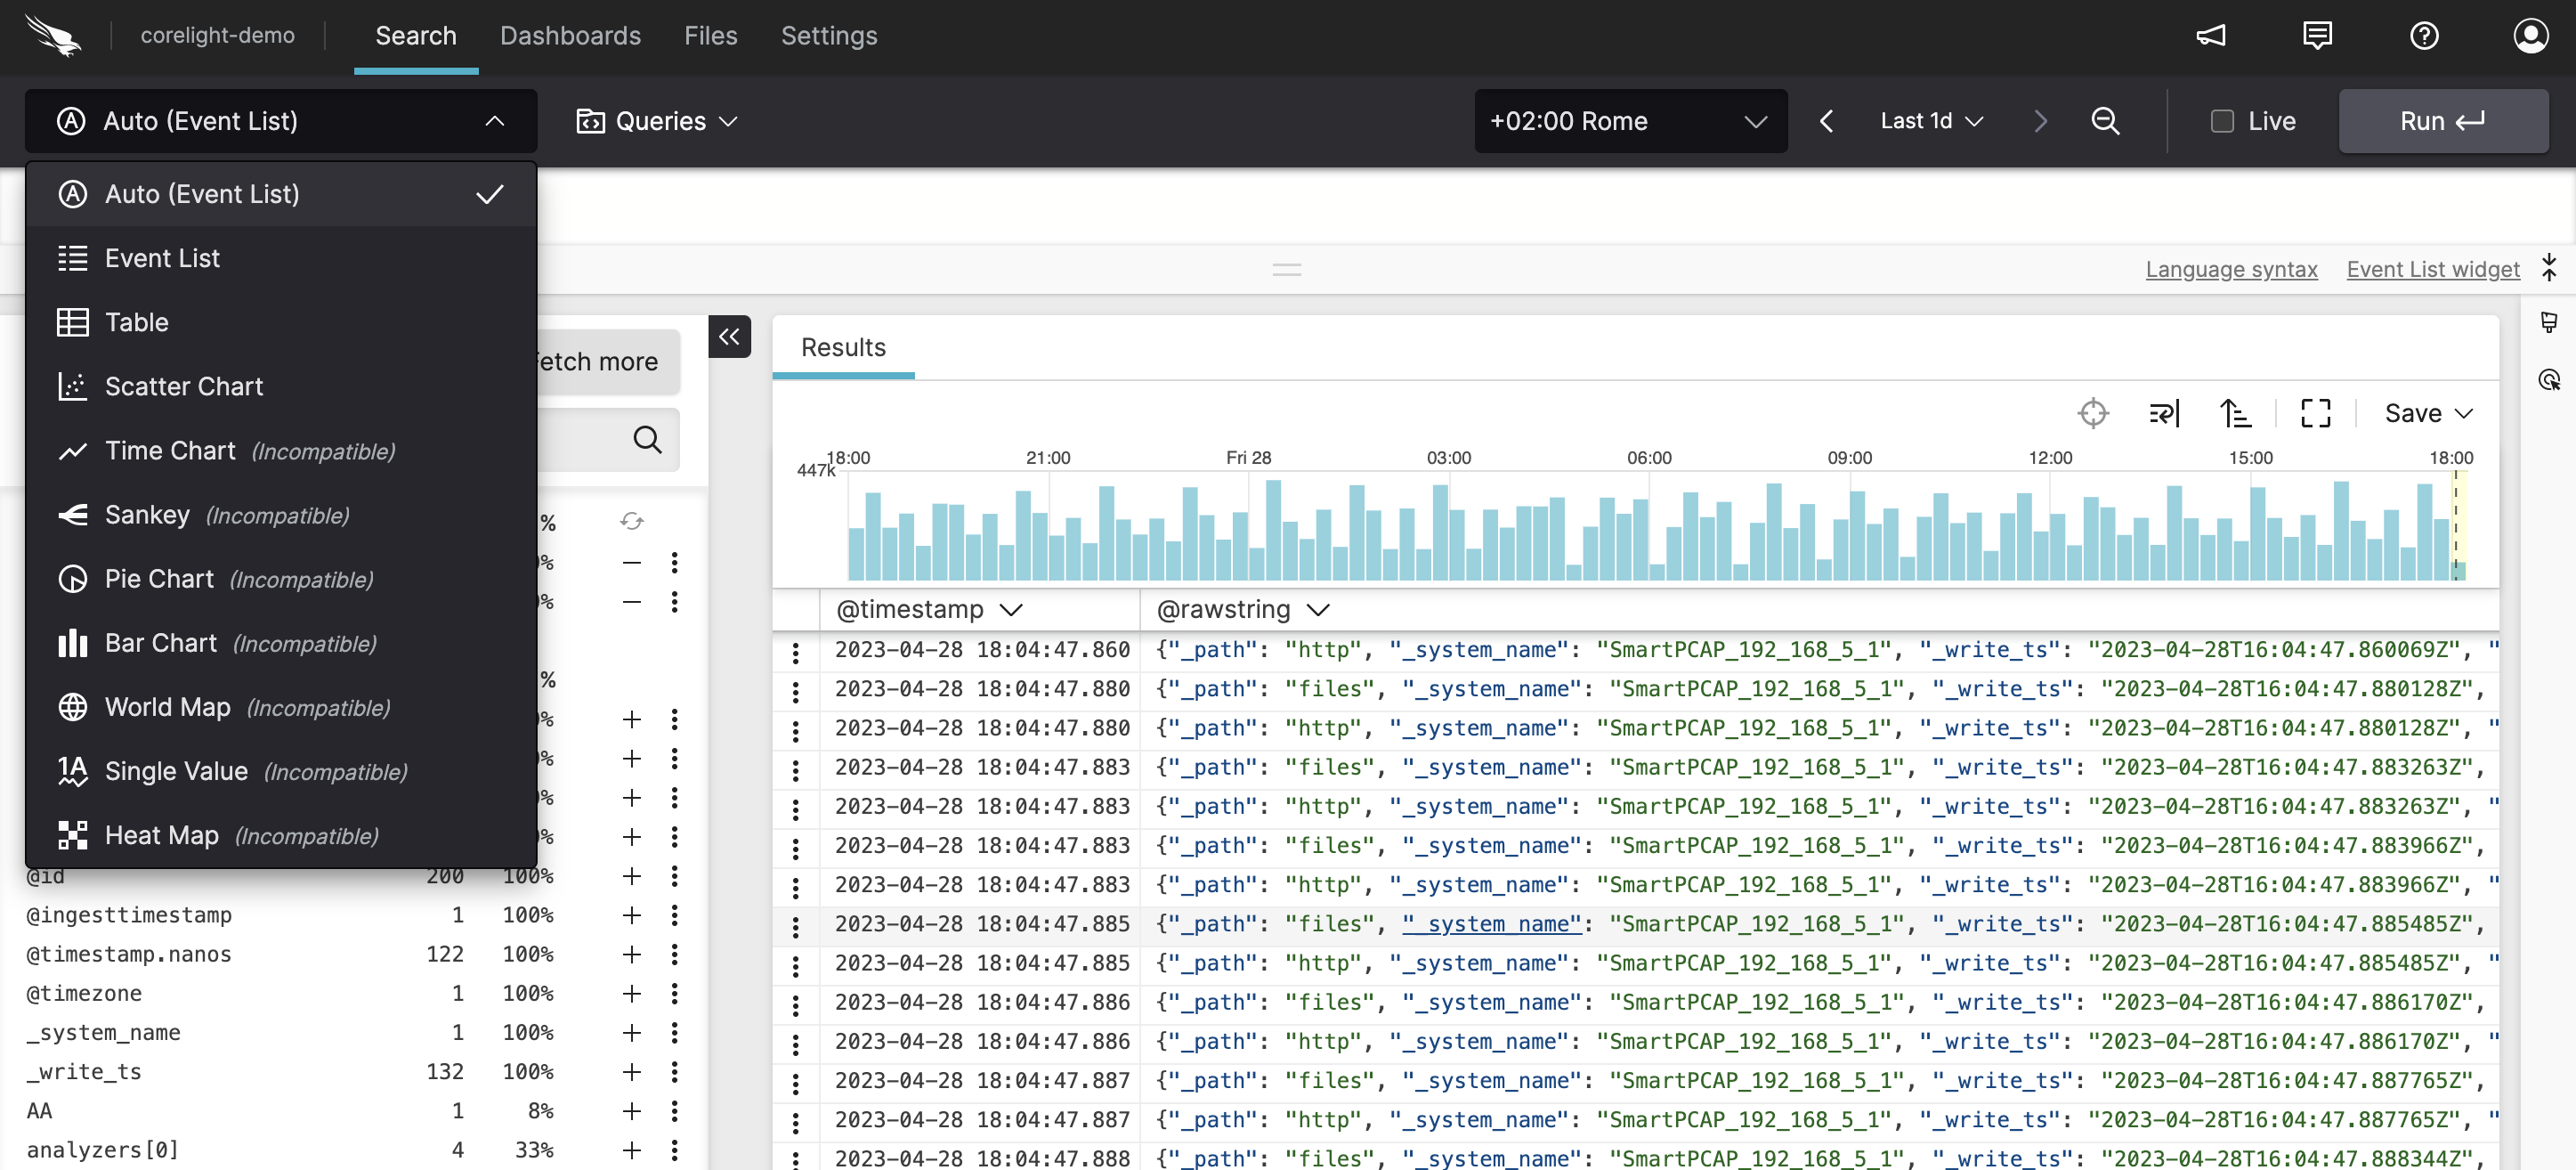
Figure 84. Widget Selector
Click the style icon to expand the Format Event List panel where you can change the style of the data displayed, see Manage Fields for more information.
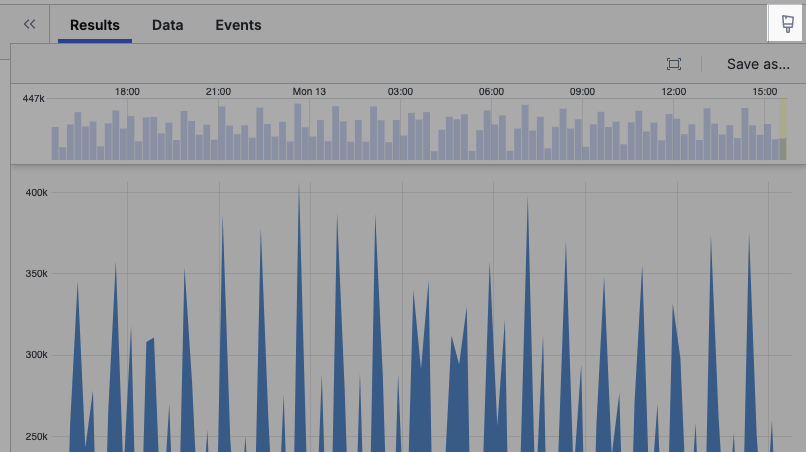
Figure 85. Changing the Chart Style
Click the double arrows to collapse the Format panel.
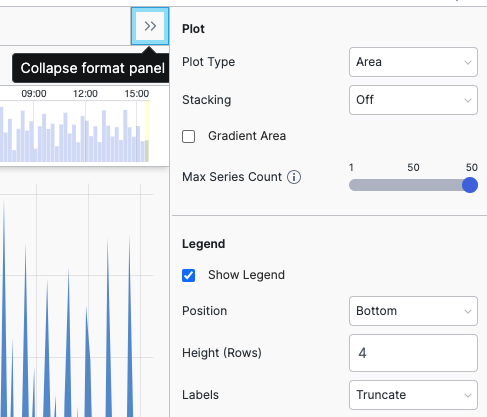
Figure 86. Format Panel