

Widget Examples Gallery
Each widget type supports multiple visual representations depending on the data structure and formatting properties you apply. This gallery shows a selection of documented variants across all widget types — select a screenshot to go to the how-to guide for that variant.
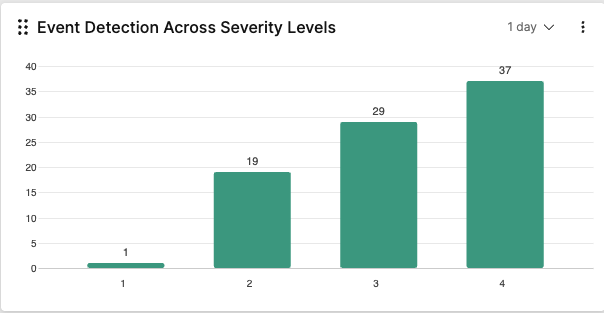
Bar Chart
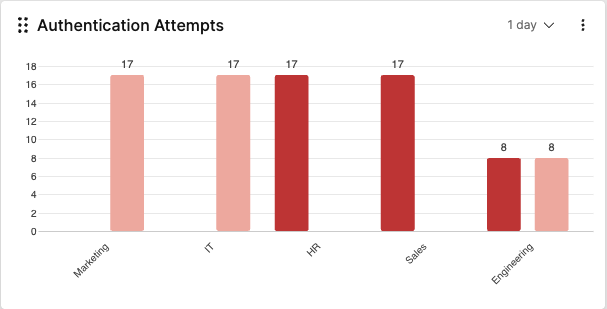
Grouped Bar Chart
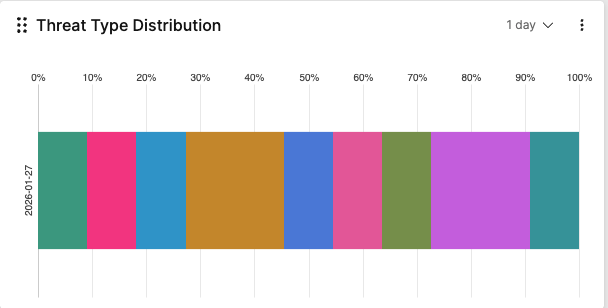
Stacked Bar Chart
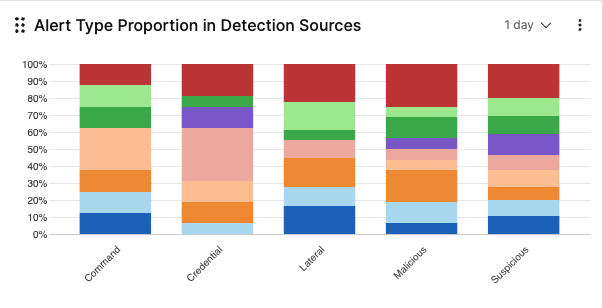
100% Stacked Bar Chart
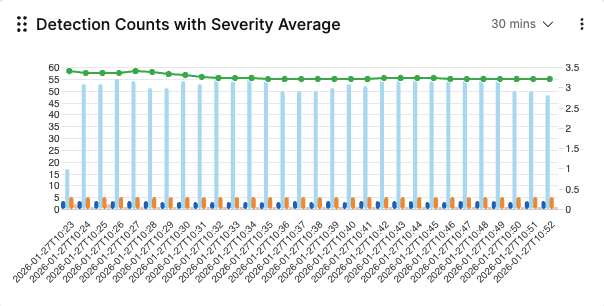
Bar and Line Chart
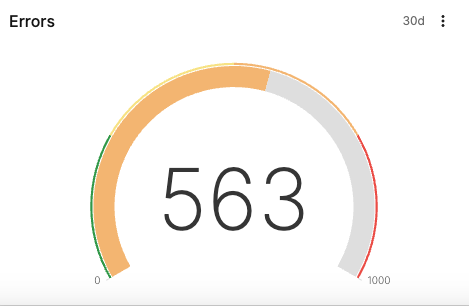
Gauge
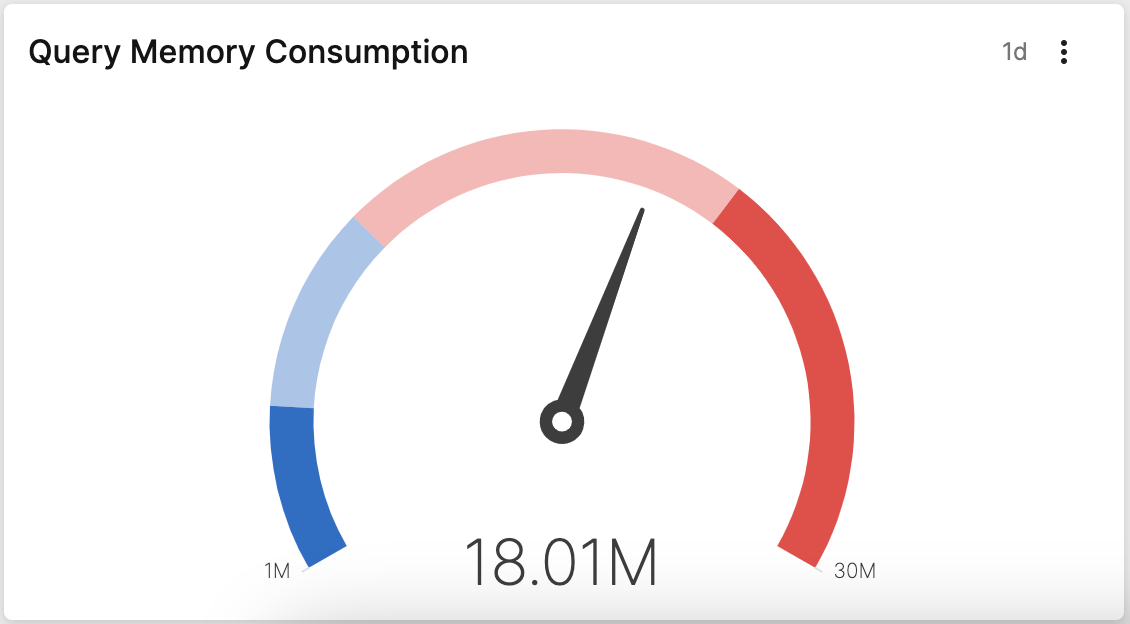
Gauge
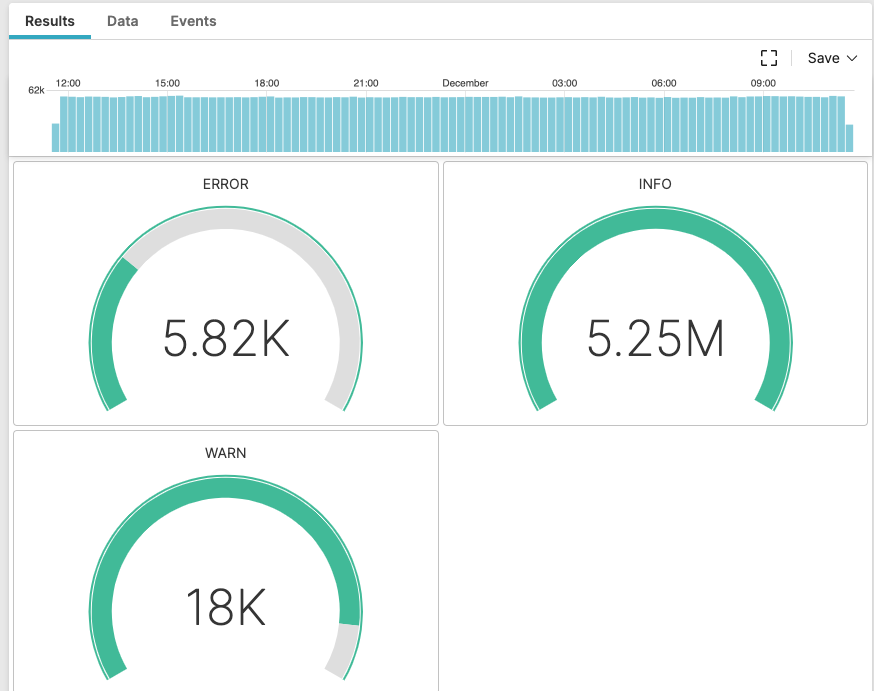
Small Multiples Gauge
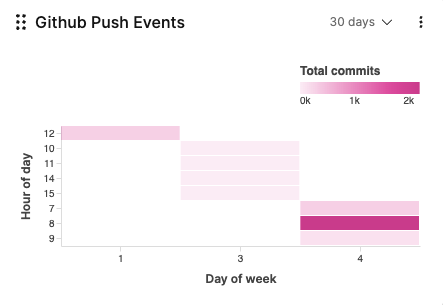
Heat Map — Categorical Grid
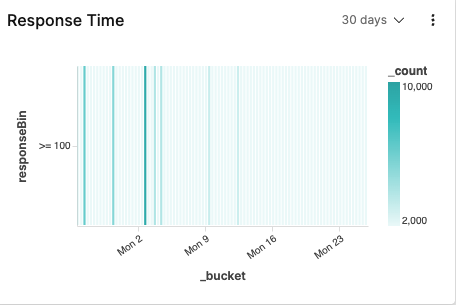
Heat Map — Time Series Distribution
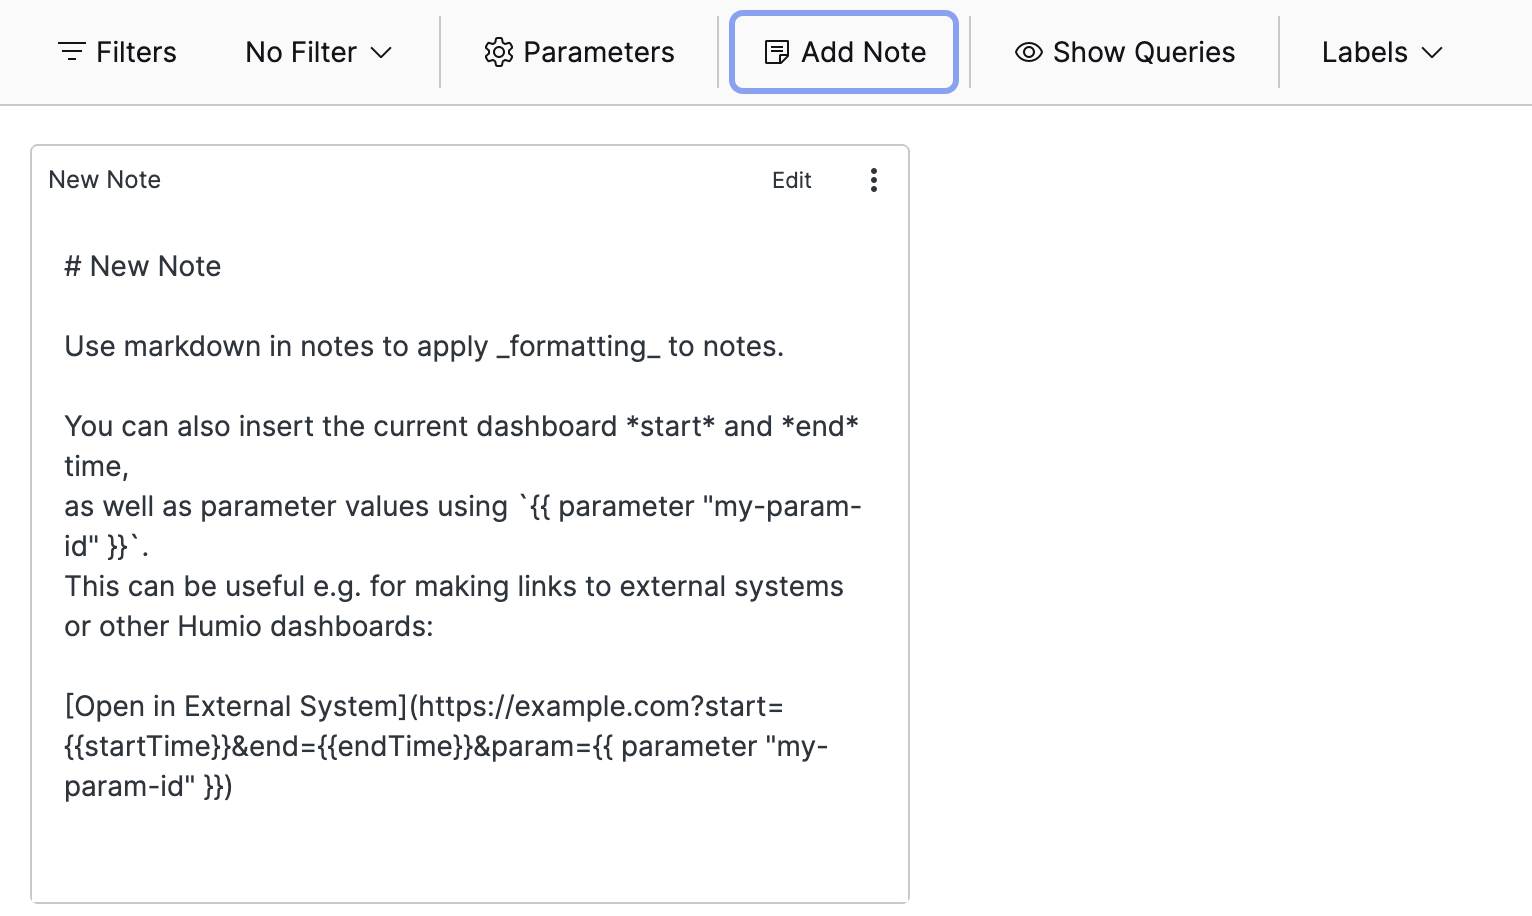
Note Widget
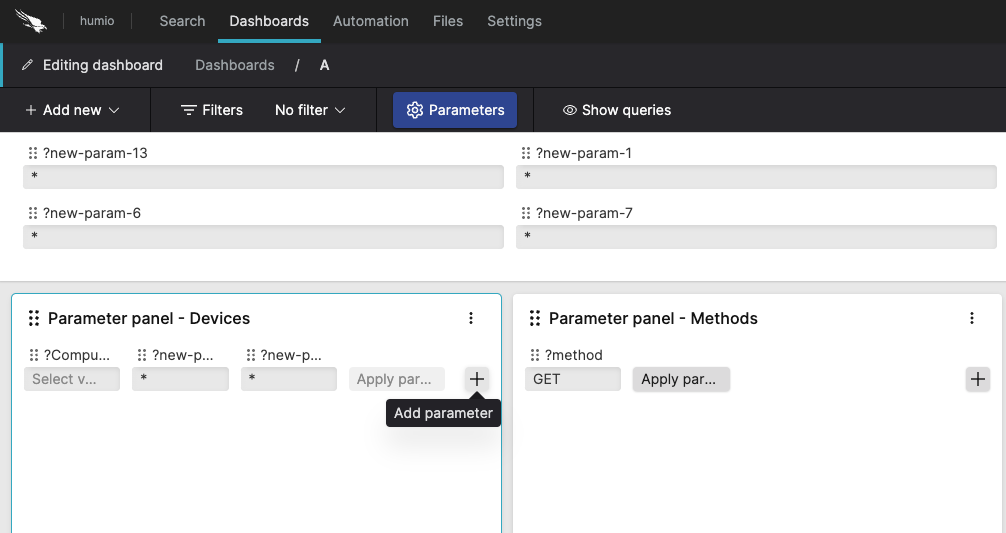
Parameter Panel Widget
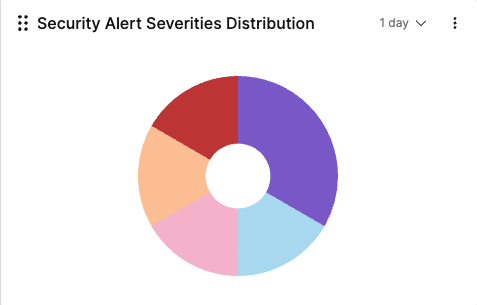
Donut Pie Chart
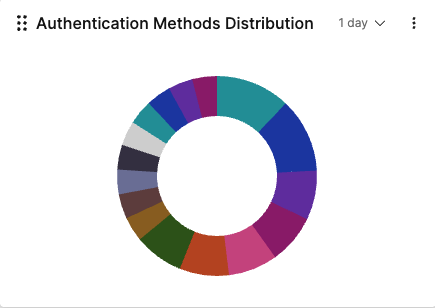
Donut Pie Chart
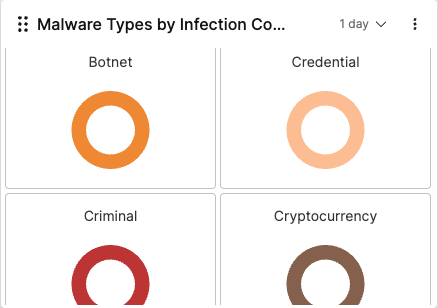
Small Multiples Pie Chart
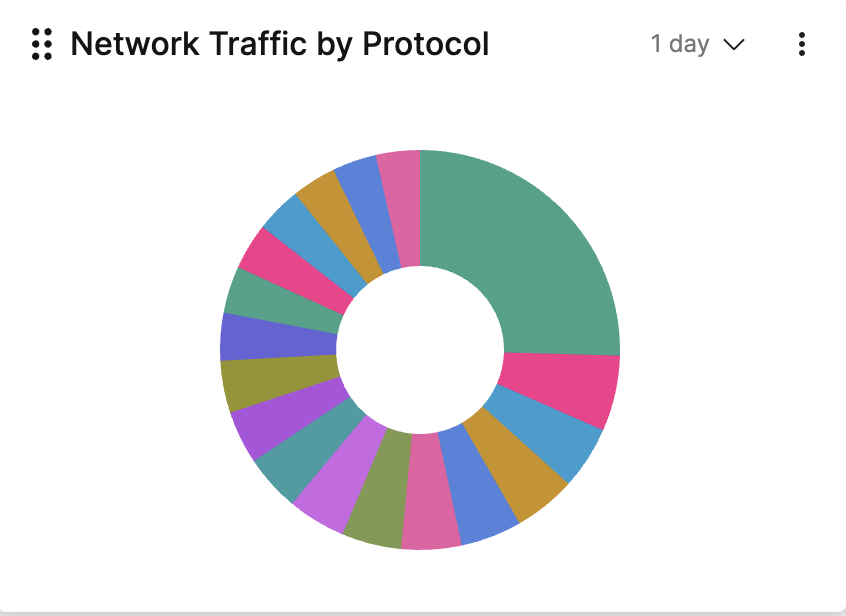
Donut Pie Chart
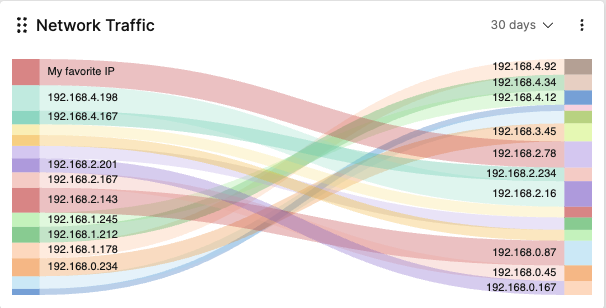
Sankey Diagram — Function-Based
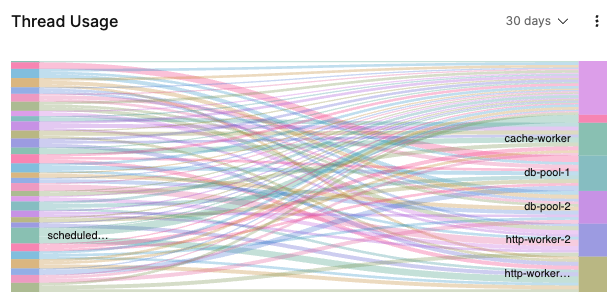
Sankey Diagram — Manual Fields
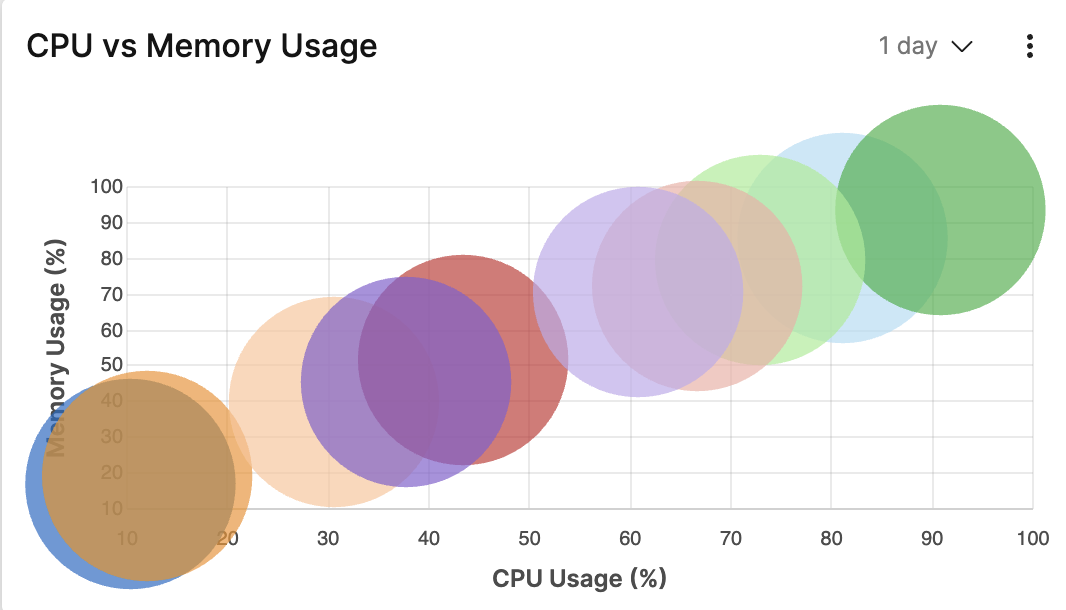
Scatter Chart
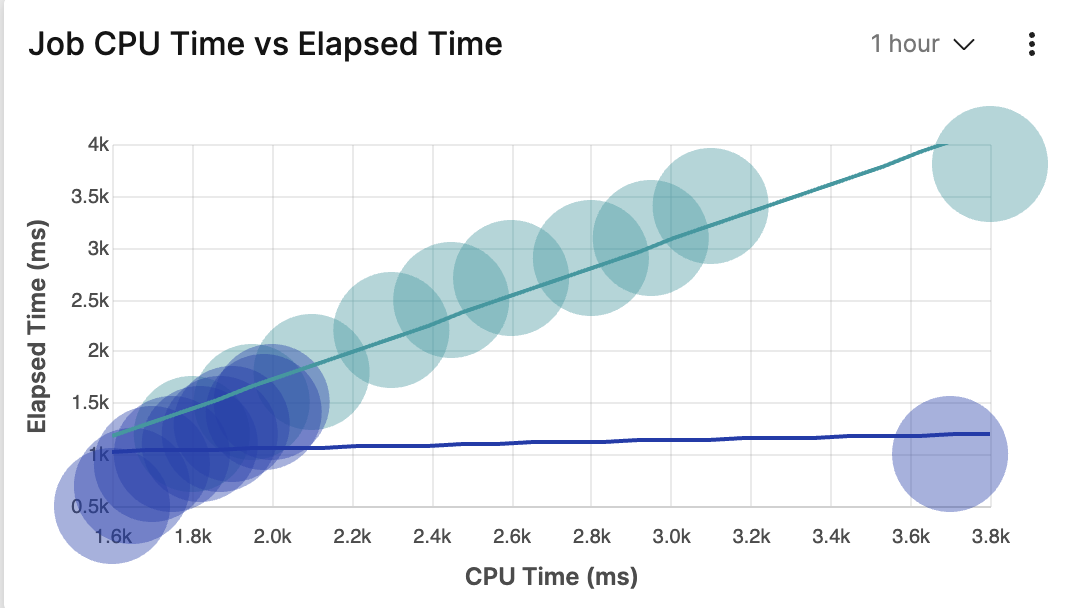
Scatter Chart — Multiple Series with Trend Lines
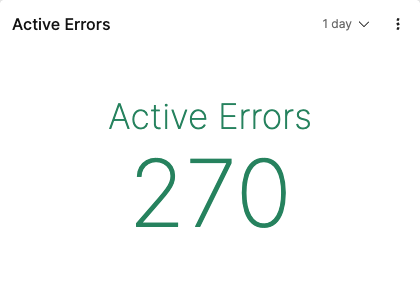
Single Value
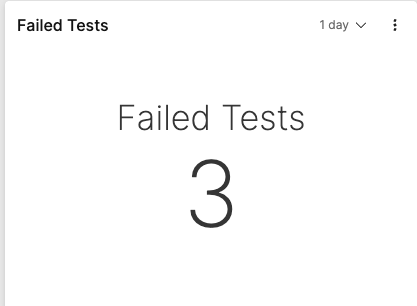
Single Value

Non-Numeric Single Value
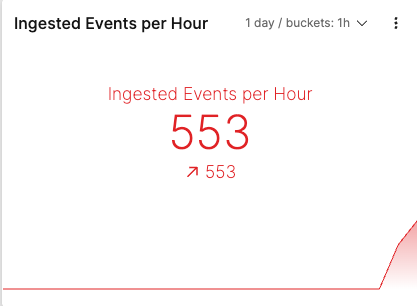
Single Value with Sparkline
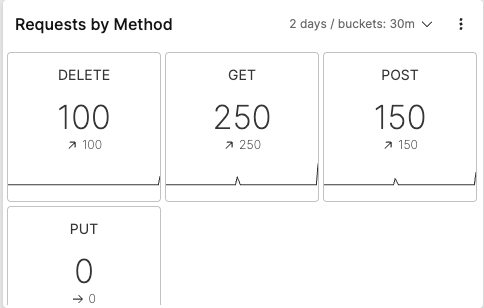
Small Multiples Single Value
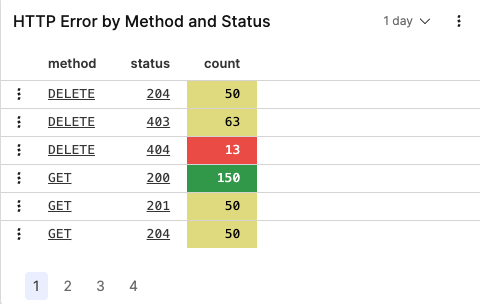
Table with Color Thresholds
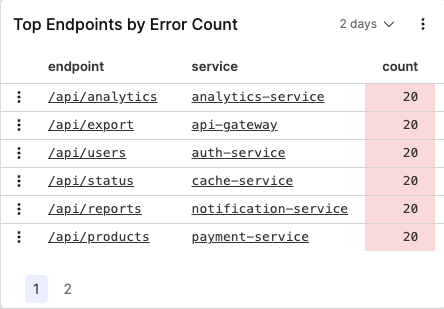
Table
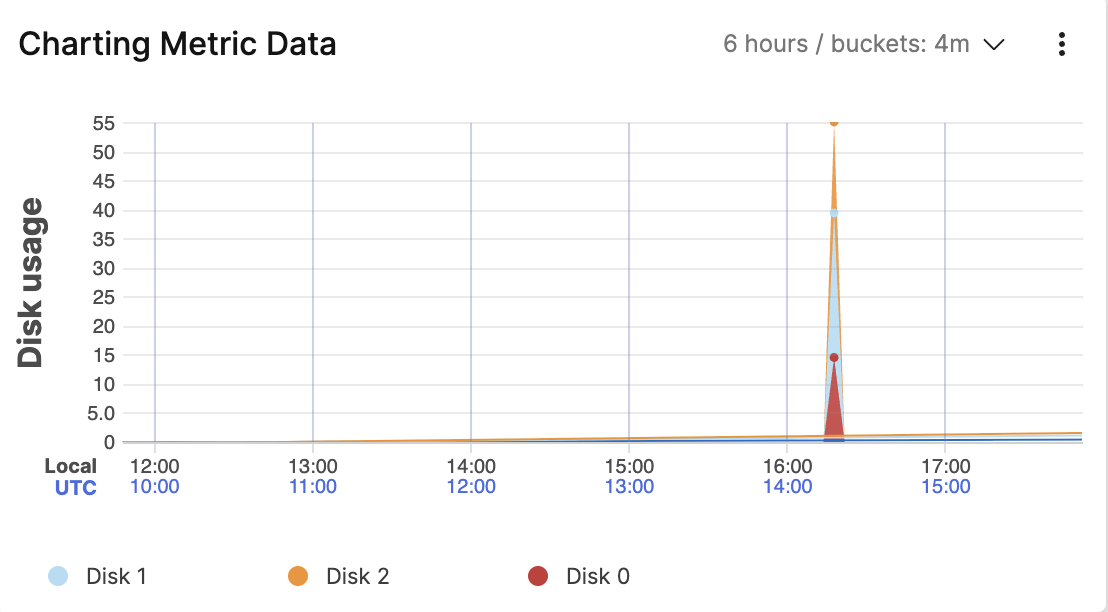
Stacked Area Time Chart
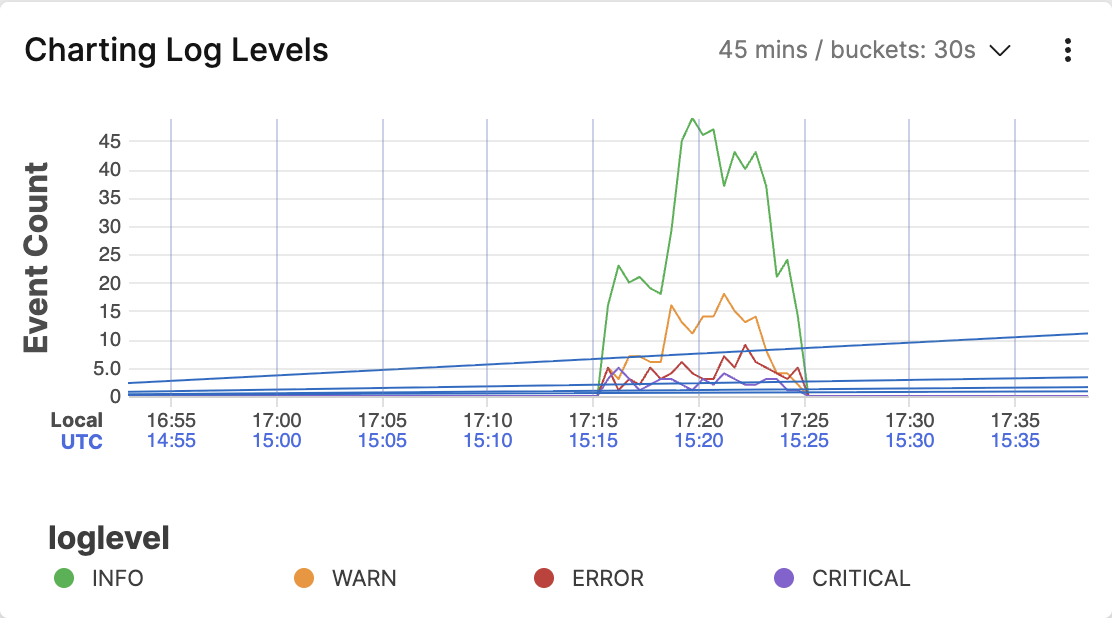
Line Time Chart — Multiple Series
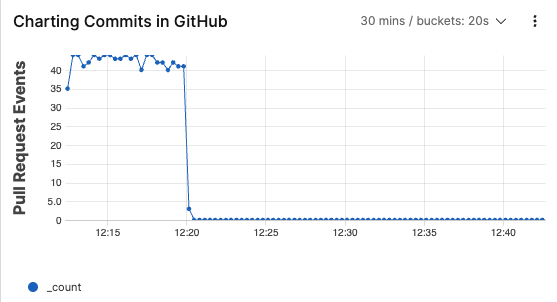
Line Time Chart — Single Series
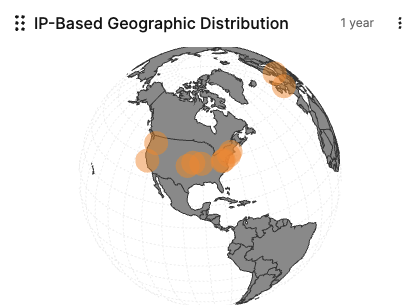
World Map — Orthographic Projection
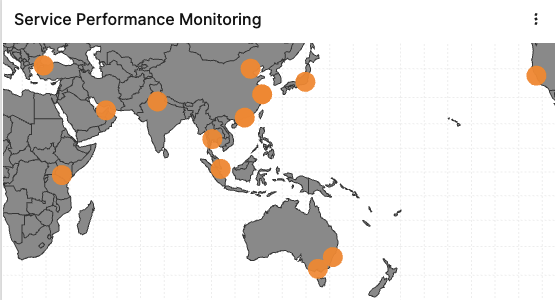
World Map — Flat Projection
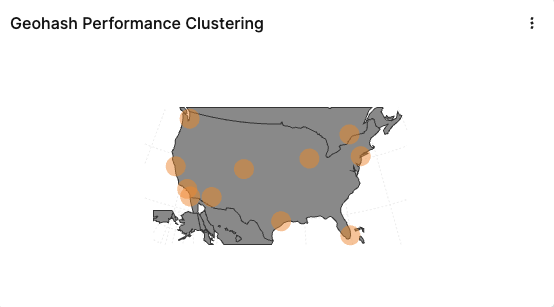
World Map — Geohash Clustering