Skip to content
LogoLogScale DocumentationLibraryGuidance Release Notes Integrations Query Examples Training APIGraphQLSearch Archives Contact Support
🔖 🔔 ੆Help button for documentation
    • Getting Data Out
    • Manage Repositories and Views
      • Create Repository or View
      • Repository and View Settings
      • Falcon LTR Repositories
      • Delete a Repository or View
    • Search Data
      • Query Editor
      • Event Fields
      • Display Fields
      • Manage Fields
      • Display Results and Events
      • Inspect Events
      • Copy Rows
      • Look Up Events
      • Show in Context
      • Format Columns
      • Column Properties
      • Field Data Types
      • Field Interactions
      • Choose Visualization
      • Highlight Filter Match
      • Change Time Interval
      • Set Time Zone
      • Save Results
      • Export Data
      • Search Status
      • Event List Interactions
      • Field Aliasing
        • Configuring Field Aliasing
        • Managing Field Aliasing
        • Searching with Field Aliasing
        • Understanding Field Mapping Requirements
        • Understanding Schema Requirements
    • Data Visualization
      • Dashboards
        • Step-by-Step Guide to Dashboards
        • Create Dashboards
        • Optimize Dashboard Performance with Persisted Aggregations
        • Manage Dashboards
        • Customize Dashboards
        • Design the Dashboard Layout
          • Dashboard Sections
        • Work with Time on Dashboards
          • Shared Time Selector
          • Widget Time Selector
          • Section Time Selector
          • Live Dashboards
          • Time Zone Settings
          • Default Time Settings for Dashboards
        • Make your Dashboard Interactive
          • Apply Dashboard Filters
          • Work with Dashboard Parameters
          • Work with Dashboard Interactions
        • Share Dashboards
          • Disabling Access to Shared Dashboards
          • Restricting Access with IP Filters
        • Export Dashboards as PDF
          • PDF Export Options
      • Widgets
        • Create Widgets
        • Manage Widgets
          • Hint: Deselect Series in Widgets
          • Limitation: Widgets with Live join() Functions
          • Hint: Embedding iFrame Widgets
        • Widget Gallery
        • Bar Chart Widget
          • Bar Chart Usage and Data Format
          • Bar Chart Examples Gallery
            • Event Detection Across Severity Levels
            • Failed and Successful Authentication Attempts
            • Threat Type Distribution
            • Alert Type Proportion in Detection Sources
            • Detection Counts with Severity Average
          • Bar Chart Property Reference
        • Event List Widget
          • Event List Usage and Data Format
          • Event List Property Reference
        • Gauge Widget
          • Gauge Usage and Data Format
          • Gauge Examples Gallery
            • Display Number of Errors
            • Display Query Memory
            • Display Small Multiple Charts
          • Gauge Property Reference
        • Heat Map Widget
          • Heat Map Usage and Data Format
          • Heat Map Examples Gallery
            • Github Push Events
            • Response Time
          • Heat Map Property Reference
        • Note Widget
            • Note Widget Property Reference
        • Parameter Panel Widget
        • Pie Chart Widget
          • Pie Chart Usage and Data Format
          • Pie Chart Examples Gallery
            • Distribution of Security Alert Severities
            • Authentication Methods Distribution
            • Malware Types by Infection Count (In Small Multiples)
            • Network Traffic by Protocol
          • Pie Chart Property Reference
        • Sankey Diagram Widget
          • Sankey Usage and Data Format
          • Sankey Examples Gallery
            • Network Traffic
            • Thread Usage
          • Sankey Property Reference
        • Scatter Chart Widget
          • Usage and Data Format
          • Scatter Chart Property Reference
        • Single Value Widget
          • Single Value Usage and Data Format
          • Single Value Examples Gallery
            • Displaying Number of Errors
            • Displaying Statistics from a Build
            • Displaying a Non-Numeric Value
            • Displaying a Trend with a Timechart
            • Displaying Values in a Grid
          • Single Value Property Reference
        • Table Widget
          • Table Usage and Data Format
          • Table Widget Interactions
          • Table Widget Examples Gallery
            • Display Different Statuses
            • Add Temporary Events and URLs
          • Table Property Reference
        • Time Chart Widget
          • Time Chart Usage and Data Format
          • Time Chart Examples Gallery
            • Charting Metric Data
            • Charting Log Levels
            • Charting Commits in GitHub
          • Time Chart Property Reference
        • World Map Widget
          • World Map Usage and Data Format
          • World Map Examples Gallery
            • IP-Based Geographic Distribution
            • Service Performance Monitoring
            • Geohash Performance Clustering
          • World Map Property Reference
    • Automation
      • Triggers
        • What Trigger Type to Choose
        • General Information About Triggers
        • Trigger Management
          • Create Triggers
          • Edit Triggers
          • Manage Triggers
        • Trigger Properties
          • General Properties
          • Configuration Properties
          • Actions Properties
          • Advanced Settings
          • Scheduled Search Properties
        • Monitor, Diagnose, and Troubleshoot Triggers
          • Monitor Triggers with humio-activity Repository
          • Aggregate Alert Errors and Solutions
          • Scheduled Search Errors and Solutions
          • Filter Alert Errors and Solutions
          • Legacy Alert Errors and Solutions
          • Errors when Using Live join() Functions
      • Actions
        • Create Actions
        • Manage Actions
        • Action Type: Email
        • Action Type: Falcon LogScale Repository
        • Action Type: OpsGenie
        • Action Type: PagerDuty
        • Action Type: S3
        • Action Type: Slack
        • Action Type: Lookup File
        • Action Type: VictorOps (Splunk On-Call)
        • Action Type: Webhooks
        • Send aggregate results to actions
        • Message Templates and Variables
      • Schedule PDF Reports
        • Scheduled Reports Security
          • Create a Scheduled PDF Role using the web interface
        • Managing Scheduled Reports
        • Create Scheduled Reports
        • Edit Scheduled Reports
        • Scheduled Report Operation and Limitations
        • Scheduled Report Errors and Resolutions
      • Persisted Aggregations
        • Persisted Aggregation Management
          • Create Persisted Aggregations
          • Configure Persisted Aggregation Properties
            • Scheduling Details
          • Edit Persisted Aggregations
          • Manage Persisted Aggregations
      • Cron Scheduling
    • Template Language
      • Template Expressions
      • Template Variable Types
      • Template Examples
Falcon LogScale Documentation
/ Getting Data Out (GDO)
/ Search Data
Content was updated:Aug 8, 2026

Save Results

It is possible to save search results, queries, dashboard widgets, and more. As it can take some time to construct a search query and if used often, saving searches and different widgets for reuse is time saving.
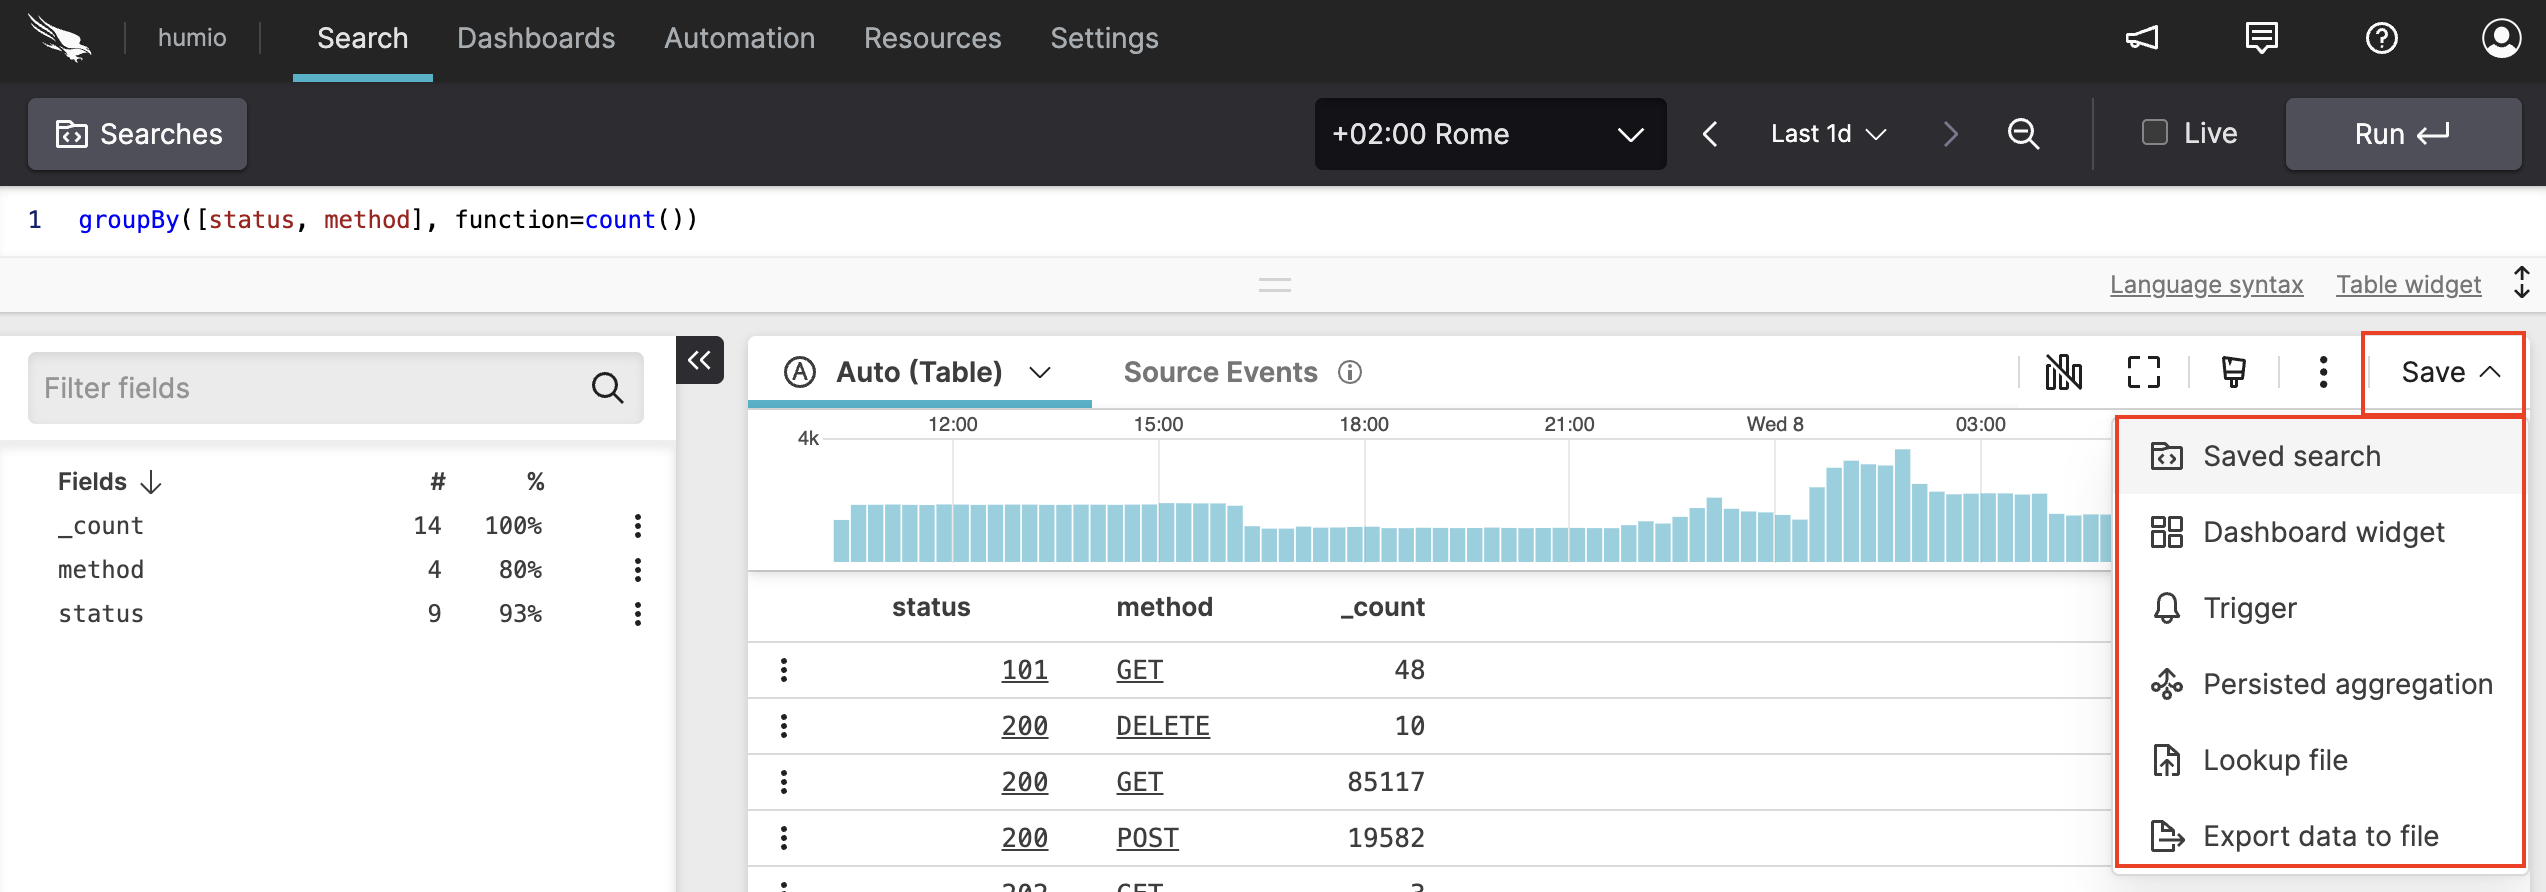
Screenshot showing the save button with its options

Figure 49. Save Queries or Other Assets


Note

Starting from version 1.252, the Save menu includes the Persisted aggregation option for creating persisted aggregations.

Screenshot showing the save button with its options

Figure 50. Save Queries or Other Assets


From any display tab, click Save and select one of the following options:

  • Saved search. You can make a saved query of your search. See Save searches for more information.

  • Dashboard widget. If your search is visualized as one of the available widgets, you can save that widget for future use. See Dashboards for more information.

  • Trigger. You can save a query as a trigger (if the type of search is appropriate), including scheduled searches. See Triggers for more information.

  • Persisted aggregation. You can save an aggregation query as a persisted aggregation that runs on a schedule and stores pre-computed results for faster querying. See Persisted Aggregations for more information.

  • Lookup file. You can save a query as a lookup file. See Lookup Files for more information.

  • Export data to file. This option will export the results of the query to a file locally. See Export Data for more information.

Support
  • Twitter
  • LinkedIn
  • Youtube

© 2026 CrowdStrike All other marks contained herein are the property of their respective owners.

  • Other articles on this topic

    • Apply Dashboard Filters
    • Create a New Saved Search
    • Dashboard Best Practices
    • Grammar Subset
    • Grant Permissions for Saved Queries
    • Grant Permissions for Saved Queries
    • Make your Dashboard Interactive
    • Manage Existing Saved Searches
    • Query Management
    • Query management
    • Save Results
    • Save Searches
    • Save searches
    • Template Examples
    • Template Expressions
    • Template Variable Types
    • Work with Dashboard Interactions
    • Work with Dashboard Parameters
    • Write Queries
  • Similar Content

    • Apply Dashboard Filters
    • Make your Dashboard Interactive
    • Template Examples
    • Template Expressions
    • Template Variable Types
    • Work with Dashboard Interactions
    • Work with Dashboard Parameters
  • Related Language Syntax

    • Referencing Resources
    • Referencing Resources
    • Saved Searches (User Functions)
    • Saved Searches (User Functions)
    • User Parameters (Variables)
    • User Parameters (Variables)
  • Terminology

    • Saved Search
  • Security (humio-audit) Events

    • Audit Log Event saved-query.create
    • Audit Log Event saved-query.delete
    • Audit Log Event saved-query.update

Enter search term