
World Map Widget
The World Map widget displays
geographical data on a world map. Different map projections are
supported, such as the standard mercator or orthographic projection.
See in Figure 161, “World Map Chart” an example of how this widget may look like.
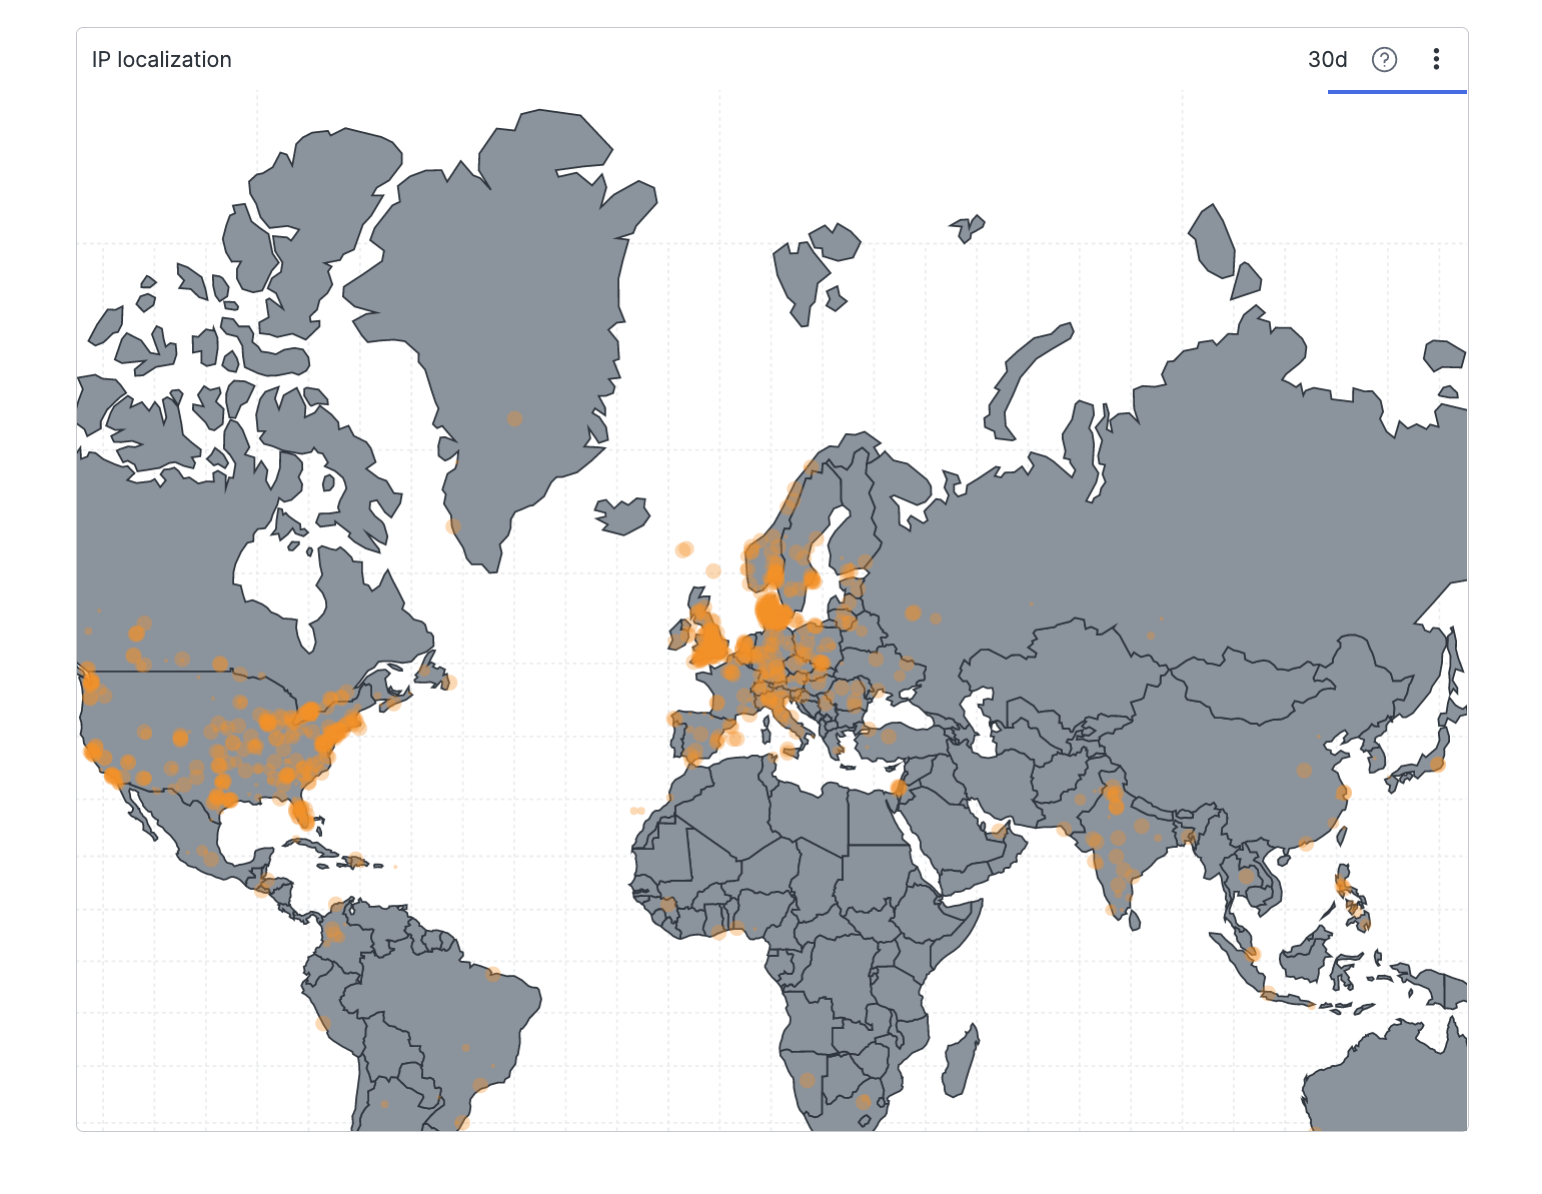 |
Figure 161. World Map Chart
Input Format
Find in table below the main fields that are typically used in the World Map widget.
| Field | Type | Description |
|---|---|---|
| lat | number | A field containing the latitude to use for geohash bucketing. |
| lon | number | A field containing the longitude to use for geohash bucketing. |
| geohash | string | OPTIONAL. A base32 geohash string to calculate latitude and longitude. |
| precision | number | The precision to use in the calculation of the embedded geohash. Usually 4 is fine for a full globe, 12 is for a small area of zoom. |
| magnitude | aggregate | A function used to calculate the magnitude (weight) of each bucket. This value is used to determine the size or opacity of the world map markers. |
If both geohash and lat and lon are specified, geohash is ignored.
The World Map widget can be used with any input that satisfies the
format above, but you will usually want to bucket locations using
geohashing. LogScale provides the worldMap()
function that helps you conform to the format.
Example 1: IP addresses
worldMap(ip=ip)Example 2: Existing geo-coordinates
worldMap(lat=myLatitudeField, lon=myLongitudeField, magnitude=avg(responseTime))Example 3: Alternative
You do not have to use the worldMap() function
in order to use the widget. You can also provide data that conforms
to the input format. The results in Example 2 can be reproduced
using the following query:
geohash(lat=myLatitudeField, lon=myLongitudeField)
| groupBy(_geohash, function=avg(responseTime, as=magnitude))
Here we use the geohash()
function to achieve the same bucketing of points as the
worldMap() function does for us. If we do not
use geohashing, we risk getting way too many points, making the
widget very slow.
Widget Properties
Use the widget's panel to configure the following properties.
Title
The title of the widget as displayed in the dashboard.
Description
The description of the time chart. This is free form text supporting markdown syntax.
This same description appears in the dashboard as a tooltip by hovering over the question mark on top of the widget.
Center
Allows you to center the map on a specific area or country. You can also zoom in or out the map. Available settings are:
Latitude
Longitude
Zoom Level
Marks
Magnitude Mode
Determines how to scale the mark for each location based on the magnitude field.
Valid options are:
None— no magnitude mode is selected so the marks are not scaled based on the magnitude field.Opacity— scale mark opacity based on the magnitude field (more opacity in the dots for larger values).Size— scale mark size based on the magnitude field (larger dots for larger values).
Depending on the mode selected:
Point Size — when the
Sizemagnitude mode is not selected, this slider allows to set the fixed size of the marks in a range between 1 and 40 pixels.Point Opacity — when the
Opacitymagnitude mode is not selected, this slider allows to set the fixed opacity of the marks in a range between 1 and 100 percent.
When
Sizemagnitude mode is selected, you can set:Min Point Size — the minimum size of the marks on each location.
Max Point Size — the maximum size of the marks on each location.
When
Opacitymagnitude mode is selected, you can set:Min Opacity — the minimum opacity of the marks on each location.
Max Opacity — the maximum opacity of the marks on each location.
Projection
Type
Valid options are:
Mercator— depicts the standard, cylindrical map projection that represent north as up and south as down everywhere while preserving local directions and shapes.Albers USA— depicts an equal area conic projection used to visualize US States.Orthographic— depicts a hemisphere of the globe as it appears from outer space.
Rotate
Allows rotation of the map. Valid options are:
Rotation XRotation YRotation Z