Skip to content
LogoLogScale DocumentationLibraryGuidance Release Notes Integrations Query Examples Training APIGraphQLSearch Archives Contact Support
šŸ”–ą©†Help button for documentation
    • Introduction
    • LogScale Overview
      • Deployment Methods
      • Log Sources
      • Data Ingestion Overview
      • Repositories
      • Queries and Querying
      • Automations
      • Building Dashboards, Widgets, Charts, and Graphs
      • Security, Logins, and Access Control
      • Package Marketplace
    • Product Tutorial
    • LogScale Video Series
    • LogScale Web Interface
      • System Tabs and Falcon Icon
      • Navigation Icons
        • Notifications
        • Releases and Release Notes
        • Help
        • Avatar icon
      • Informational Panels
      • Left-hand Navigation Panel
      • Table Components
      • Repositories and Views
        • Repositories and Views Menubar
        • Search Interface
        • Dashboards Interface
        • Automation Interface
        • Parsers Interface
        • Files Interface
        • Settings Interface
      • All Dashboards
      • Data Ingest
    • Manage Your LogScale Account
Falcon LogScale Documentation
/ Getting Started
/ LogScale Web Interface
/ Repositories and Views
Content was updated:Mar 16, 2026

Search Interface

The Search interface is where you can search your data in your repository.

FigureĀ 20, ā€œSearch interfaceā€ highlights the common elements in the Search web interface:
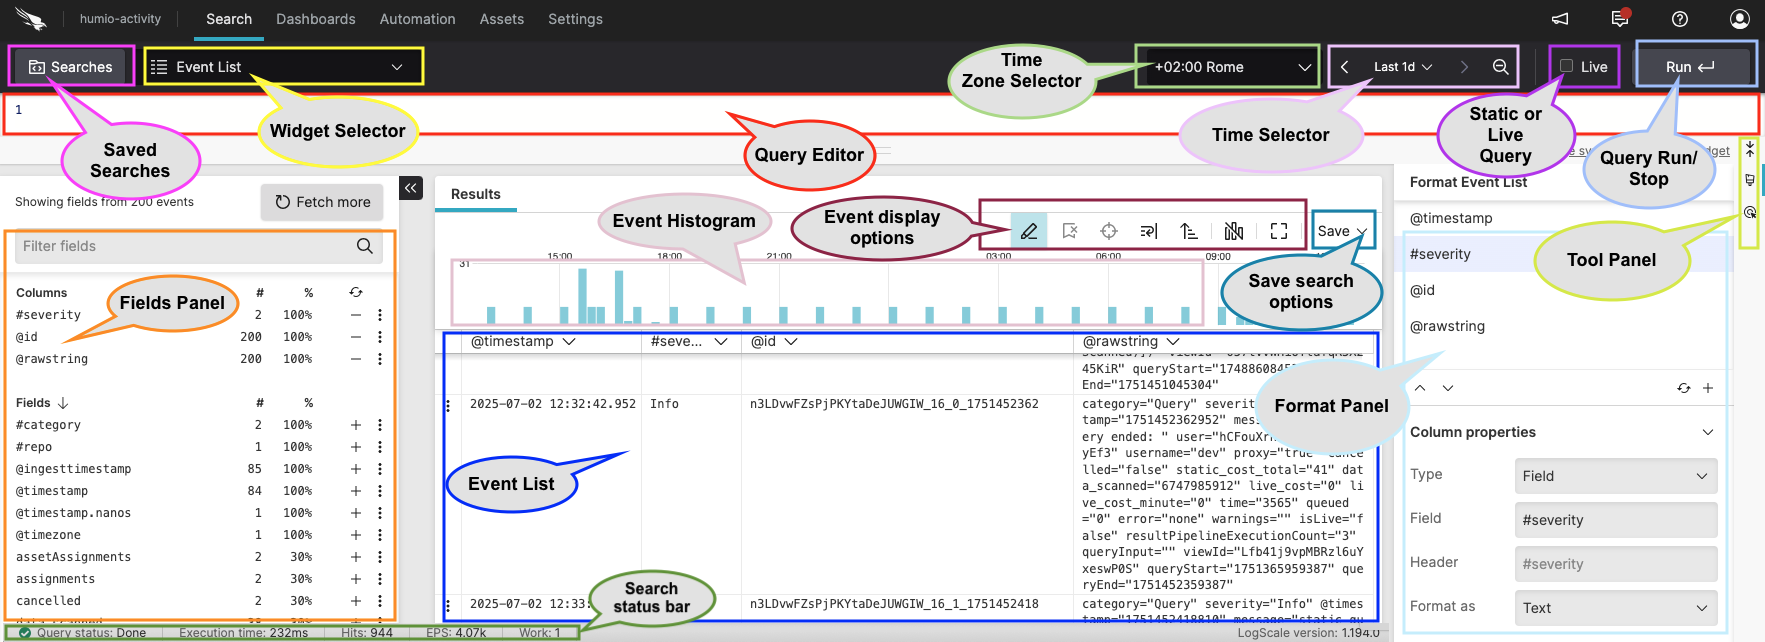
Screenshot showing the Search UI elements

FigureĀ 20.Ā Search interface


Common elements in this page include:

  • Query Editor aka Search Box

  • Fields panel

  • Event List which may include different results tabs depending on the functions used in the query

  • Save results menu

  • Event histogram, aka Event distribution chart, that shows the distribution of events over time

  • Search status bar

  • Searches button to explore your saved, recent and favorite queries

  • Widget Selector dropdown menu for different data visualization

  • Time interval selector dropdown

  • Timezone selector dropdown

  • Live checkbox to choose whether to run your query as live or static

  • Run / Stop buttons to run the query or stop it

  • Tool Panel to access different functionalities such as active interaction with the data or event line wrapping

  • Format Event List panel to format the Event List (field properties, size, etc.) or to access column formatting

For more information on LogScale extensive search functionalities, see Search Data.

Support
  • Twitter
  • LinkedIn
  • Youtube

Ā© 2026 CrowdStrike All other marks contained herein are the property of their respective owners.

Enter search term