
Table Widget
The Table widget displays data in rows
and columns.
This widget is best used with aggregate functions like
groupBy() or table() to output
a predefined number of fields; for example, a table that displays HTTP
GET methods and their response time.
The table() function displays data in the order
provided by the query, and the Table
widget allows to additionally format the information sorted by the
function.
See in Figure 147, “Table Chart” an example of how this widget looks like.
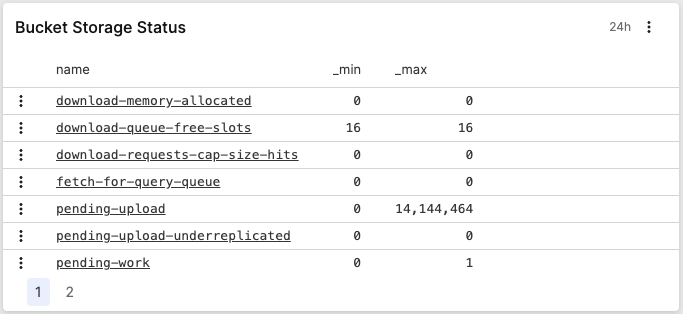 |
Figure 147. Table Chart
Input Format and Example Query
Assume we have a service producing logs like the ones below:
2018-10-10T01:10:11.322Z [ERROR] Invalid User ID. errorID=2, userId=10
2018-10-10T01:10:12.172Z [WARN]  Low Disk Space.
2018-10-10T01:10:14.122Z [ERROR] Invalid User ID. errorID=2, userId=11
2018-10-10T01:10:15.312Z [ERROR] Connection Dropped. errorID=112 server=120.100.121.12
2018-10-10T01:10:16.912Z [INFO]  User Login. userId=11
To figure out which errors occur most often and show them in a table on one of the dashboards, a query like this can be used:
loglevel = ERROR
| groupBy(errorID, function=[count(as=Count), collect(message)])
| rename(errorID, as="Error ID")
| table(["Error ID", message])
What this query will do is:
count the number of errors bucketed by their errorId
show a human readable message in the table and not just the ID by using the
collect()function, to ensure that the value of the message field makes it through the groupBy phase — which otherwise only includes the series field (errorId) and the result of the aggregate function (count().rename the errorID field to Error ID as this will be the header in the table.
ensure the order of the columns by using the
table()function.
Table Widget Properties
From the widget menu (see Figure 103, “Widget Menu”) click to set:
Title
The title of the widget as displayed in the dashboard.
Description
The description of the table. This is free form text supporting markdown syntax. The description appears in the dashboard as a tooltip when hovering over the question mark on top of the widget.