Alert Properties
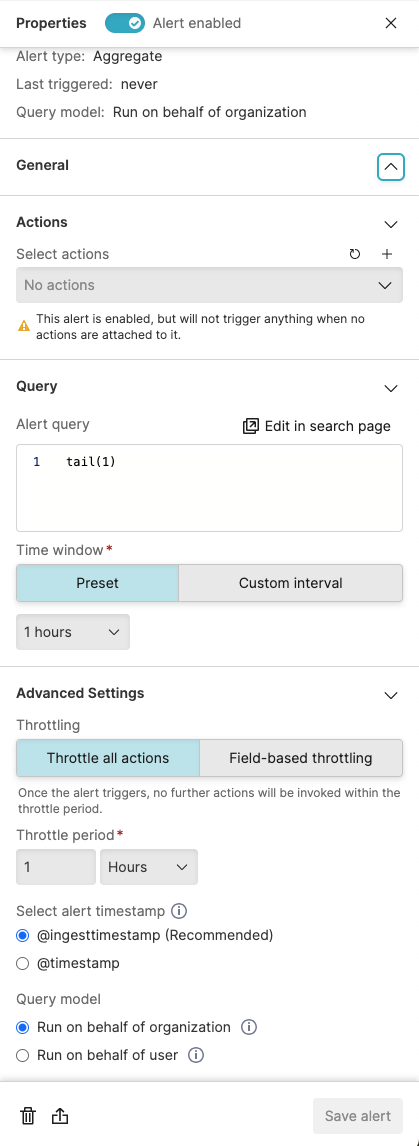
The following properties are available and configurable from the side panel:
 |
Figure 137. Alert Properties Panel
Alert Enabled indicates that the alert is enabled (new alerts are automatically enabled). To disable the alert, untoggle this button. Disabled alerts do not execute the corresponding query or trigger actions.
Info provides information on the alert such as when it was last generated, the type e.g. Filter and the query model.
General
Change the Name and enter a Description of what causes the alert to be triggered.
Categorize alerts using Labels. Existing labels are presented as a list of checkboxes, or you can enter a new label and create and select it. Labels can be used within the UI to filter alerts, see Managing Alerts for more information.
Actions that are suitable for the alert can be added for LogScale to take when the alert is triggered. The list of actions triggered when the query matches can be modified from here.
To delete an existing action, click the sign next to each action.
The following behavior applies:
Any actions being executed when the alert is updated will be completed, and the new list of configured actions will be triggered when the alert triggers again.
An alert will not be executed until there is at least one configured action.
See Actions for more information on actions.
Query
Alert query — click to modify the query: you will be redirected to the
Searchpage.Time window — allows to set the time interval for the alert (in seconds, minutes, etc.). In Aggregate Alerts, available options are Preset (choose from a predefined list) or Custom interval to set other preferred time intervals.
When using Custom interval in Aggregate alerts, please be aware that only the following inputs are valid:
1-80 minutes in intervals of 1 minute (1, 2, 3, ..., 80)
82-180 minutes in intervals of 2 minutes (82, 84, 86, ..., 180)
1-24 hours in intervals of 1 hour (1, 2, 3, ..., 24)
Representing the values with a different unit is also possible. These are examples of valid options:
82 minutes or 4,920 seconds
24 hours or 86,400 seconds
12 hours or 720 minutes
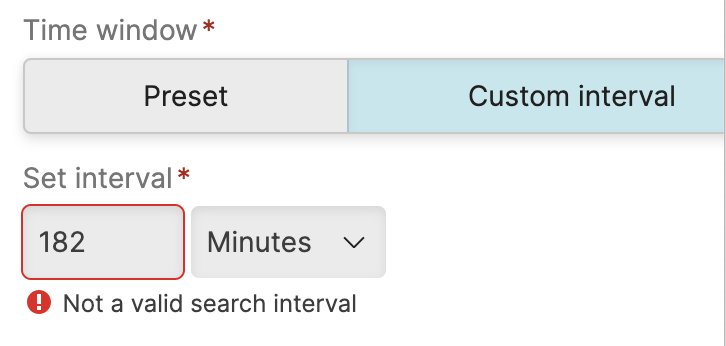
In case invalid inputs outside of the allowed ranges are entered, the UI displays a warning message:

Figure 138. Invalid Search Interval
Advanced Settings include:
Throttling enables how often an alert is triggered to be set. Throttle all actions or specify a field to throttle. For more information on configuring throttling, see Setting Alert Throttle Period.
Select alert timestamp This setting is available for Aggregate Alerts only.
Options are:
(when the event is coming to LogScale) — the default and recommended option, it ensures complete results on full data and guarantees that all events have been ingested. On the other hand, choosing this option implies that the original order of events is not preserved.
(when the event actually happens) — for events with an identifiable timestamp, this option runs the query on that specific event time. Alerts using this option are triggered based on immediate but partial results when there are delays in the ingest pipeline.
The triggering mode can be altered via GraphQL for handling ingest delays. For more information, see FAQ: How to handle ingest delays in aggregate alerts and scheduled searches.
The alert timestamp options can be changed anytime from the side panel. Your alert timestamp selection is reflected in the footer of the Time Interval panel, see Change Time Interval for more details.
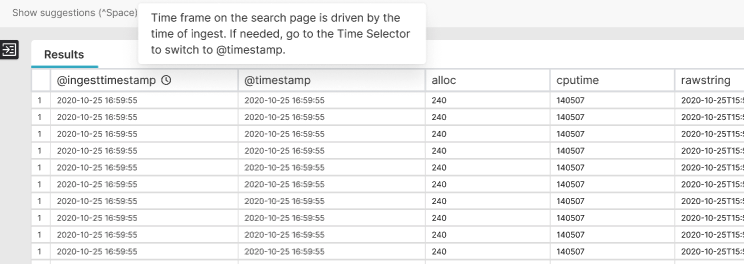
The selected alert timestamp appears as a new column in the Event List, identified by a tiny time icon: the column will show the time frame the page is actually running on, driven by the chosen timestamp:

Figure 139. Timestamp Selection in Event List
Query model
Run on behalf of organization. You can see and edit this field if you have
ManageOrganizationsorrootsystem permissions. See also Organization Owned QueriesRun on behalf of user runs the alert on behalf of another user i.e. using their permissions; click this field to get a list of available names to pick from, or directly enter the name of the user to run the alert as. You can see and edit this field if you have the
ChangeTriggersToRunAsOtherUserspermission.