Basic query principles
LogScale queries are executed through a series of statements. The input of the search process is composed of event data from the selected repository or view. For each statement in the query, the input to the statement is a list of events. The corresponding output is also a list of events, with the output of one statement being piped through to the input of the next statement, filtering, augmenting, or aggregating data in the process, as illustrated in this graphic:
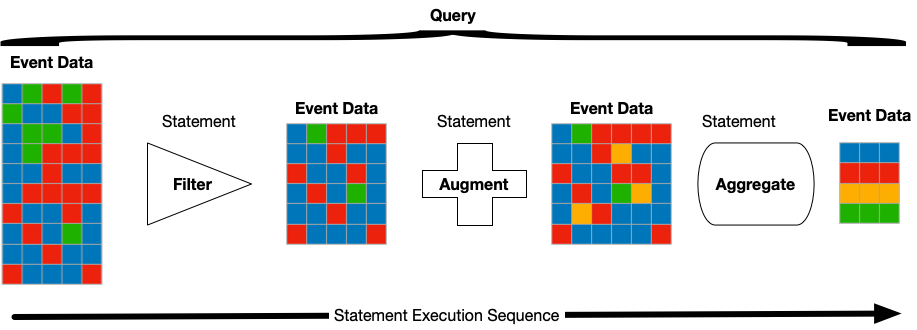 |
In the above diagram, each row represents an event in the stream of events, and each block represents a field of the event. There may be a varying number of fields in each event, and the event set may not have a consistent set of fields. This is because the data is created from log files — which may be missing fields, or they may contain a wide variety of different log lines containing diverse information.
In between each statement is a pipe (for example,
|) that feeds the event data from the
previous statement into the next statement. For example, in the following
query, the first line filters by the IP address, then the data is piped,
using the pipe symbol, into the groupBy() function
that aggregates the filtered list of events from the previous statement.
ipaddress = /192.168.0/
| groupBy(method)
Tip
The pipe methodology within LogScale is similar to the piped as used with a shell or at the command-line on a Linux system.
Understand event data sets during a query
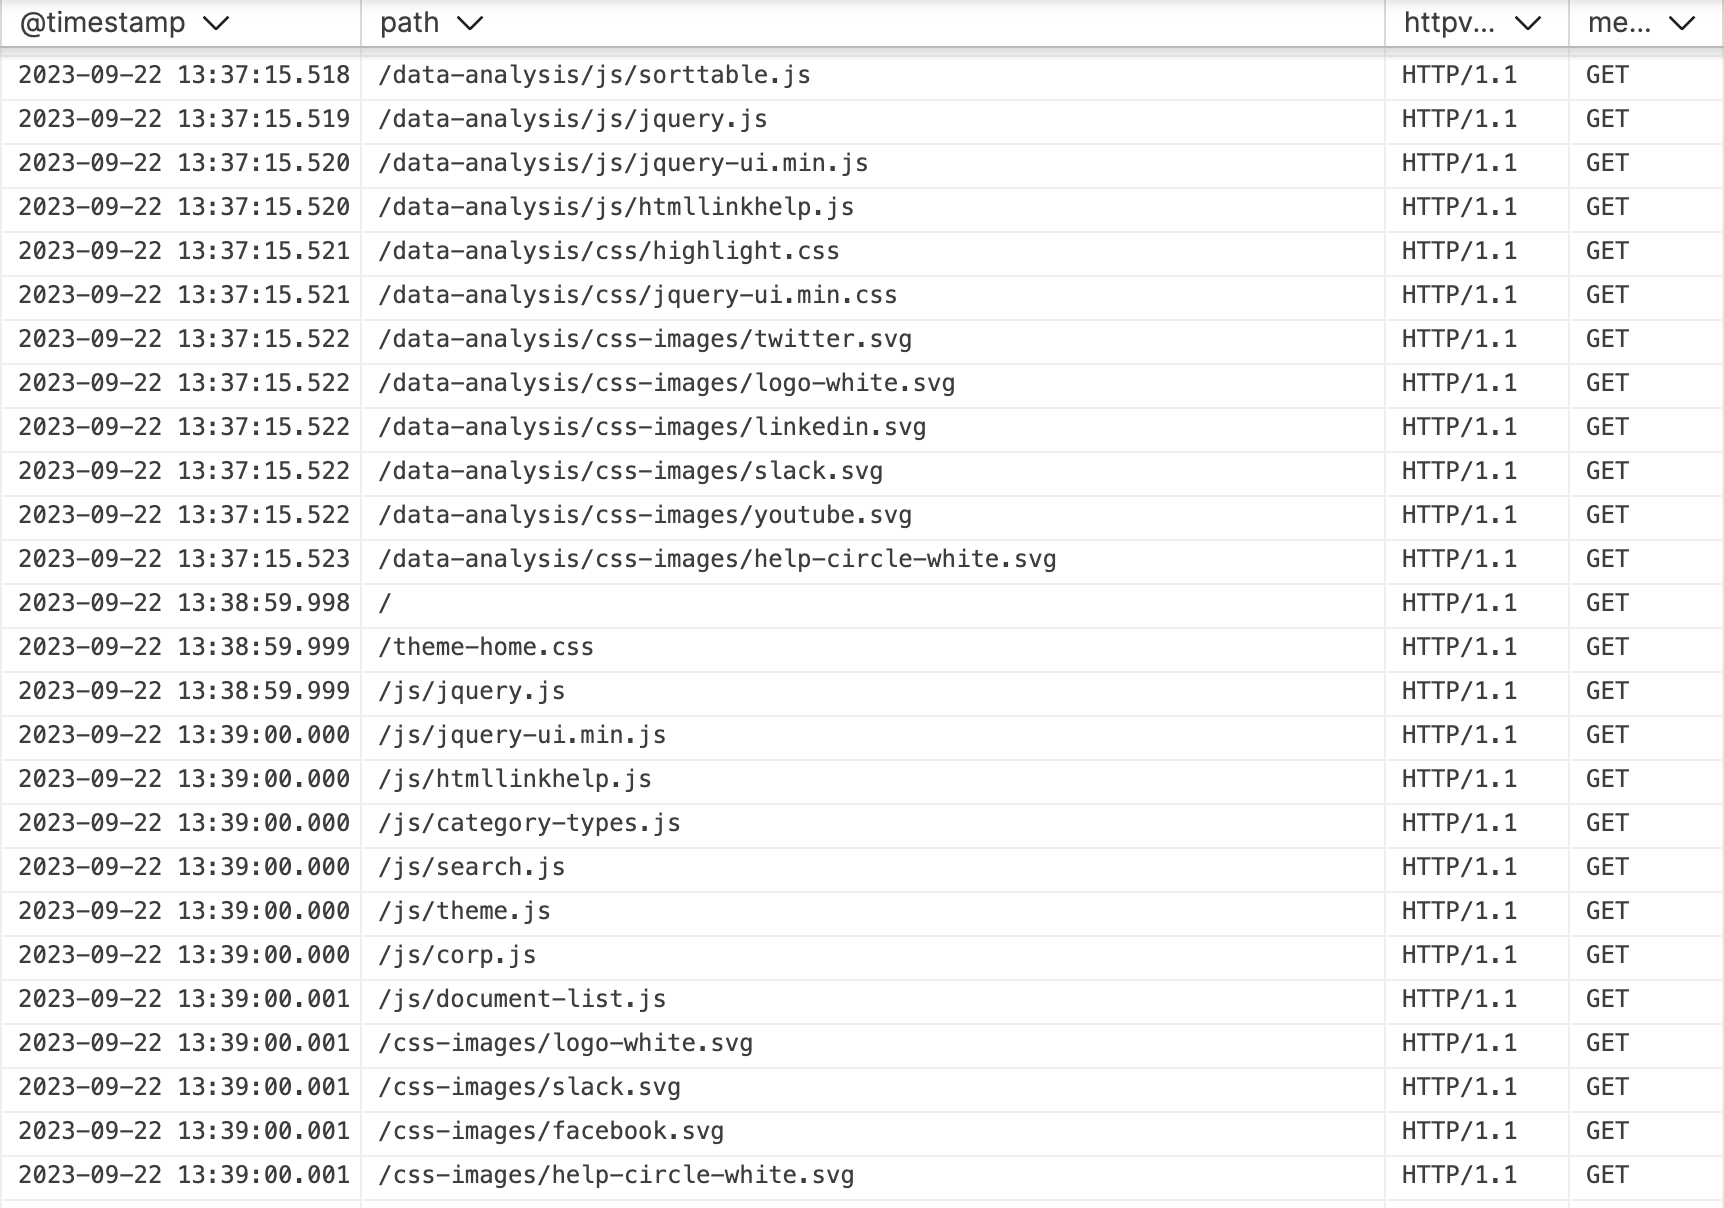
To see what this looks like in terms of the event set, the screenshot here is a sample list of events. Each row is an event. This example in particular is showing a consistent list of fields.
 |
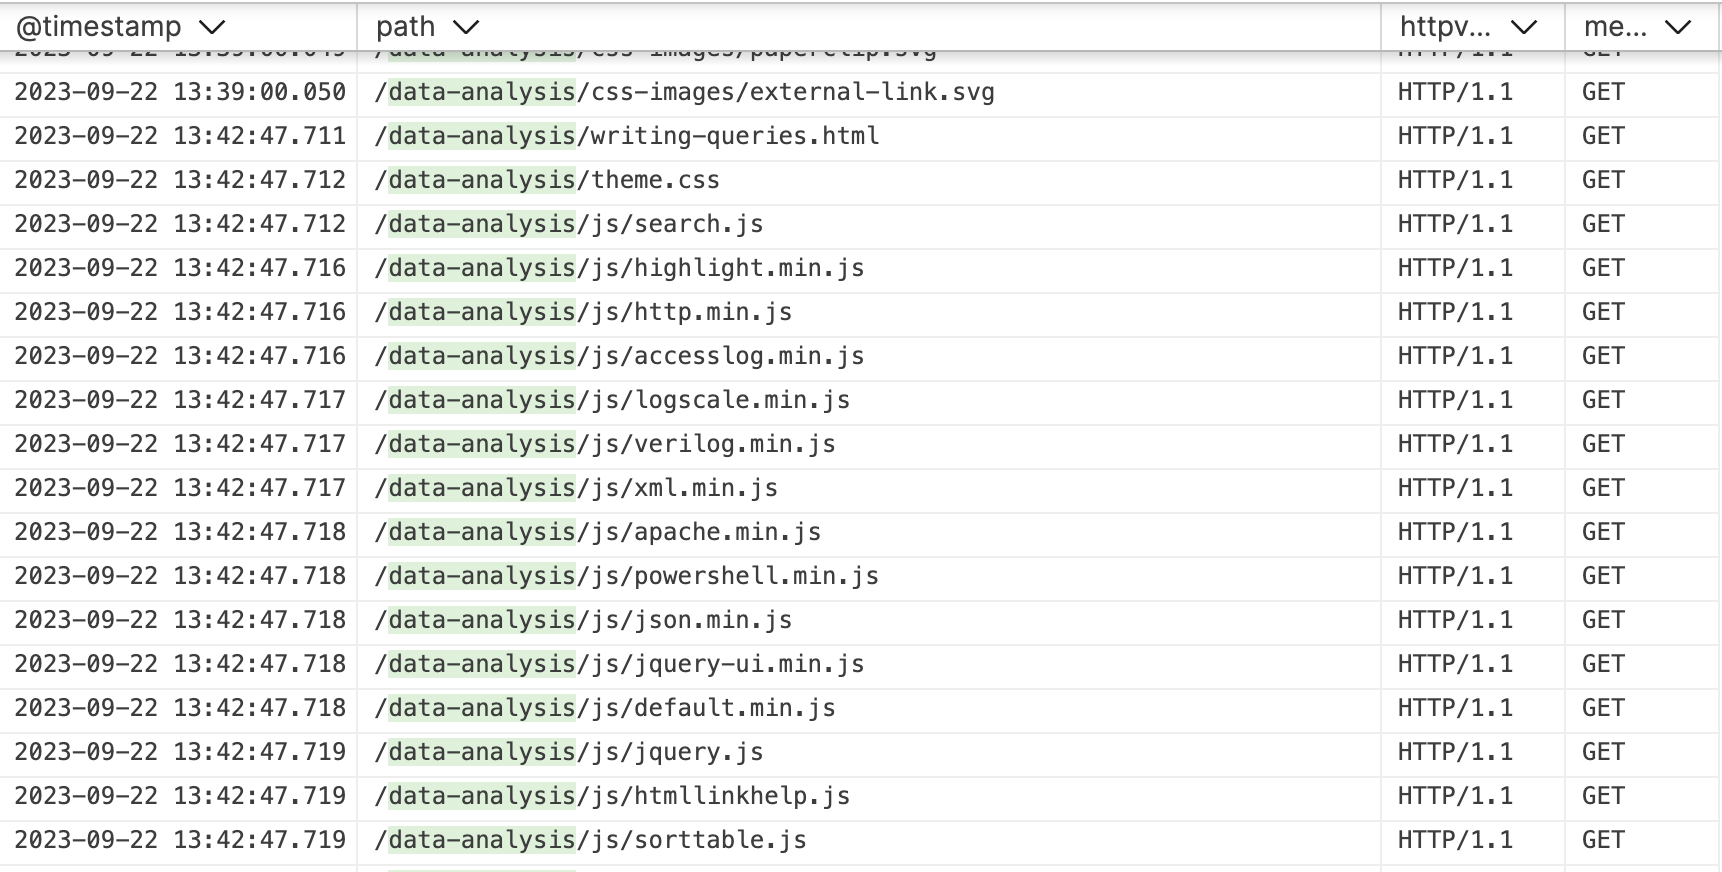
Let's apply a filter to that list, a filter like this:
"data-analysis"The result is still a list of events, but now it is filtered by the text in the statement:
 |
We can also parse the timestamp, and we can format it only to the date using this query:
"data-analysis"
| formatTime(format="%F",field=@timestamp,as=fmttime)
The above adds a field — through the
as parameter —
named fmttime to each event.
Here is the results of that addition:
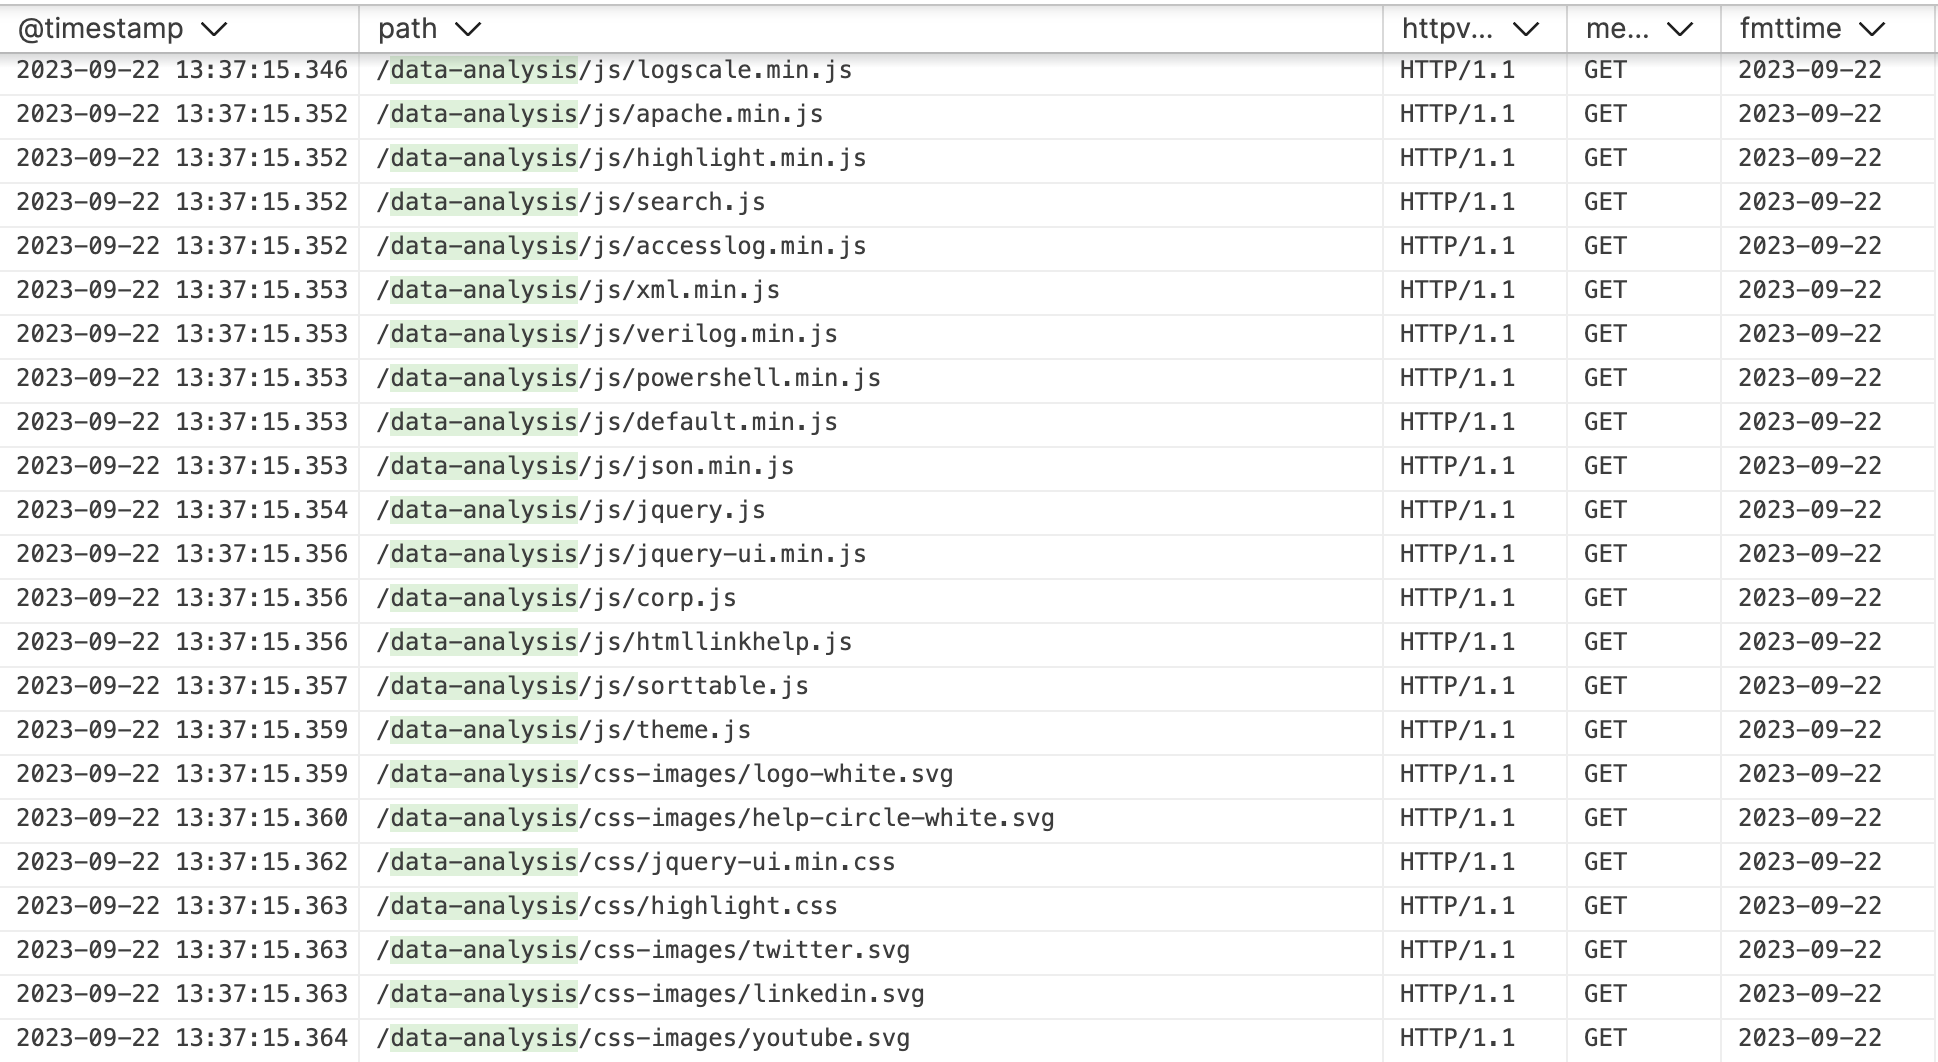 |
The set of events in this case has not changed. However, each event now contains the fmttime field.
We can aggregate this data by that date using the following:
"data-analysis"
| formatTime(format="%F",field=@timestamp,as=fmttime)
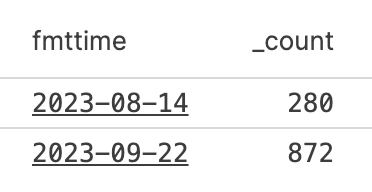
| groupBy(fmttime)
This results in a simplified set of events — in this case just two events — with two fields: the aggregate field name, fmttime; and the aggregate count field, _count. Here's what's returned:
 |
We can futher process the events, to add the
math:log() value of the
_count field like so:
"data-analysis"
| formatTime(format="%F",field=@timestamp,as=fmttime)
| groupBy(fmttime)
| logcount := math:log(_count)
This will generates a new event set like so:
 |
The resulting event set shows how the event data set is always a part of the query process. It allows constant modification of the event set to suit the required output.
Query statement order
When filtering the data, some of the individual rows will be filtered from the event data set. When augmenting the events, additional fields will be added (in orange) — and when aggregating the data is summarised and quantified.
Note that even the aggregated data is represented as a set of events with fields of data. Because the event set at every point within the query is in the same format, the event and event fields can be manipulated at any time. This means that aggregated results could be further manipulated or filtered before the final result set is created.
For example, a query could perform the following actions on an HTTP access log, in this order:
Filter the original events to select the IP addresses.
Augment the data by formatting the time into the date format.
Augment the IP address by looking up the hostname.
Augment the data by adding a field with the IP address location.
Aggregate the data by counting the number of times the event occurred, summarised by the IP address.
However, because the data is always represented as a list of events, the order could be changed. Here's how that might play out:
Aggregate the data by counting the number of times the event occurred, summarised by the IP address.
Augment the data by formatting the time into the date format.
Augment the data by adding a field with the IP address location.
Filter the original events to select the IP addresses.
Augment the IP address by looking up the hostname.
The result would be the same, although the performance would be affected. For quicker processing with less drain on resources, it is always better to filter events first to reduce the number of events that must be processed or augmented.
There are multiple potential ways of achieving the same result set, but the ordering can have a significant impact on the performance of the query.
These basic principles are used in all queries throughout LogScale in order to filter, augment, and structure the information for processing.