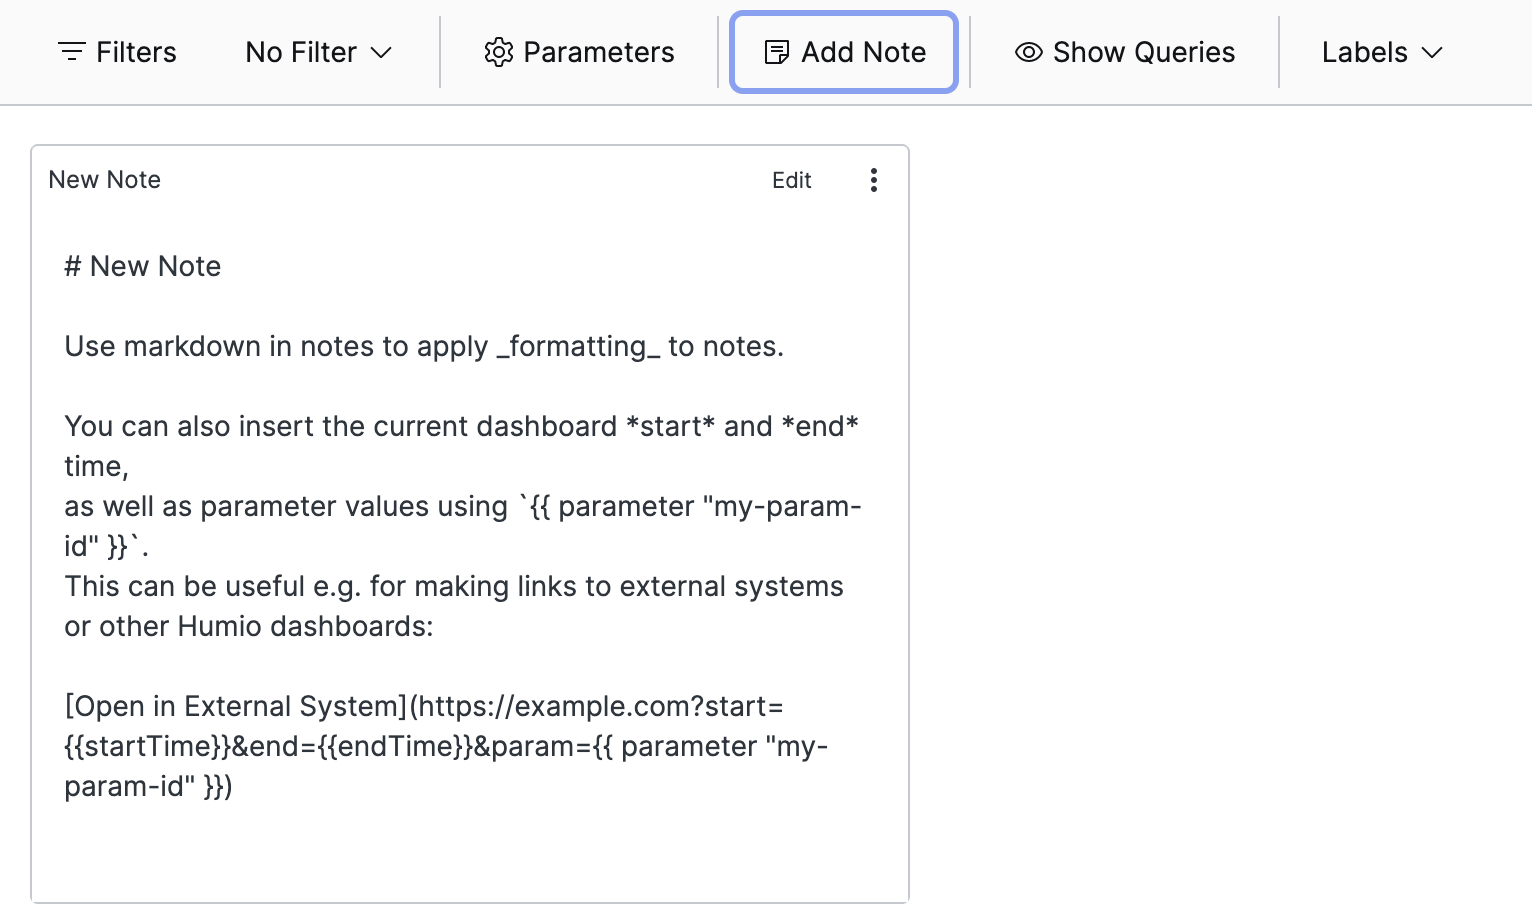
Note Widget
The Note widget is used to add any text
block to your dashboard using standard
Markdown
syntax syntax. For example, you can:
Add contextual information for dashboard users.
Include any important links, for example to related dashboards, pages or other tools.
Provide guidelines for users on how to interpret the dashboard or use interactive elements (like parameters or interactions).
 |
Figure 160. Note Widget
Example Markdown Note
## Instructions
This dashboard contains the current status of our systems. These links will take you to relevant external systems:
- [Grafana Dashboard using this dashboard's time range](https://play.grafana.org/d/000000012/grafana-play-home?orgId=1&from={{startTime}}&to={{endTime}})
- [Host Details LogScale Dashboard](/my-repo/dashboards/19213?host={{ parameter "host" }})
Here is a kitten:
Templates
As you might have noticed in the example above, you can inject values
into your notes using embedded template expressions. A template
expression is wrapped in {{ ...
}} (double curly braces).
This is especially useful when used to create links to external systems, where you can pass information from the dashboard as part of the URL.
An expression is either a variable name or a function call. Here are the variables and functions available in template expressions.
Note Widget Variables
{{ startTime }}
The start of the current global dashboard time interval — as selected in the Time Selector field. It does not matter if you have activated global time or not, this will always be available.
It is formatted as a milliseconds instant,
1561584065821.
This is very useful when you want to use the dashboard's current time interval to look at details in another system or dashboard.
{{ endTime }}
The end of the current global dashboard time interval — as selected in the Time Selector. It does not matter if you have activated global time or not, this will always be available.
It is formatted as a milliseconds instant, for example
1561584095932.
This is very useful when you want to use the dashboard's current time interval to look at details in another system or dashboard.
Template Functions
parameter
Usage: {{ parameter "<PARAM_ID>"
}}
Example: {{ parameter "hostname"
}}
Inserts the current value of a dashboard parameter.
External Images
LogScale's default content security policy (CSP) prevents loading
images from external servers. Displaying images from other domains is
possible by setting the environment variable named
STATIC_IMAGE_CONTENT_URL. For example, to allow images
from the www.lolcats.com domain, start LogScale with this environment
variable set:
STATIC_IMAGE_CONTENT_URL=https://www.lolcats.com
See STATIC_IMAGE_CONTENT_URL for more information.
Widget Properties
In the widget's side panel (Figure 121, “Widget Menu”), click the icon and the brush icon to configure the following properties.
Title
The title of the note as displayed in the dashboard.
Description
The description of the note. This is free form text supporting markdown syntax.
The description appears in the dashboard as a tooltip when hovering over the question mark on top of the note.
Colors
Text allows to change the default font color of the note.
Background sets a color for the note's background.