
Display Fields
The Fields Panel in the LogScale
Search interface is a tool for exploring
and understanding the data in your repositories. It provides an overview
of all the fields available in your data, along with metadata about each
field such as the number of distinct values and the percentage of events
that contain the field.
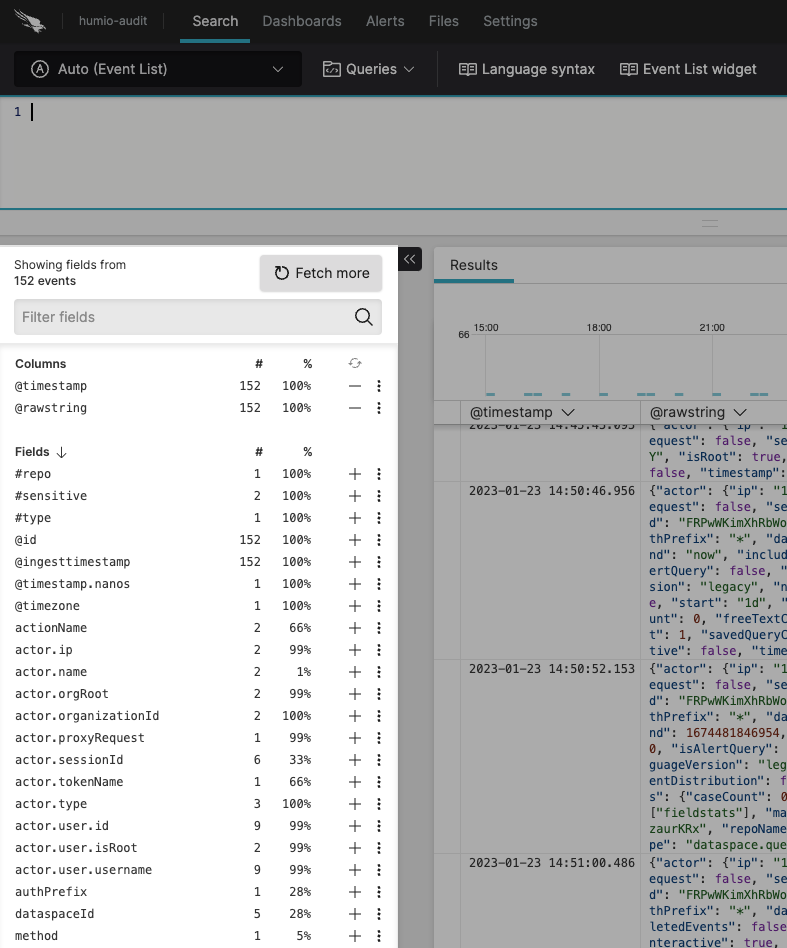 |
Figure 62. Fields Panel
The Fields panel displays the following:
Columns lists the fields shown in the data display tabs such as Event List. You must select at least one column.
Fields lists all other fields available for queries. Click to display these fields. Click the third column next to a field to add a star (★) and move the field to the top of the known fields.
# indicates the number of distinct values observed for that field, which is the field cardinality.
% indicates the percentage of events that have this field.
adds the field to the currently displayed result.
removes the field from the currently displayed result.
🔄 resets to default fields by removing any fields previously added.
triggers Field Interactions.
Filter fields allows you to search for a field by typing its name.
allows you to get more than the default 200 events displayed.
The fields presented after clicking this button are a representative subset of the data in the repository, but do not necessarily include all fields, as we do not look at all data: newer data is favored, so older data within your selected time interval is less likely to be returned.
Conversely, if the older and newer data have roughly the same fields, then the results are likely be accurate because the data is relatively uniform.
This behavior improves field statistics, as the fields presented in the Fields panel might not match the events you are currently viewing.
The Fields panel can be collapsed by clicking the double arrow next to it.
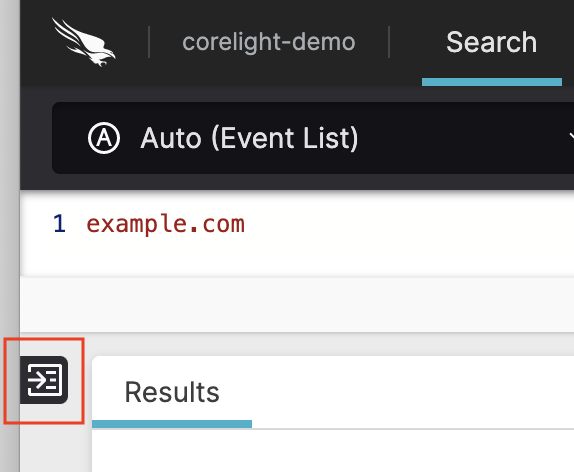 |
Figure 63. Expand the Fields Panel