
Apply Dashboard Filters
Filters allow you to reduce data displayed on a dashboard and to look at a subset of your data across all widgets simultaneously. Unlike parameters , filters operate as global dashboard-level constraints. You can save filter configurations as presets to quickly switch between different views of the same dashboard for various environments, systems, or customers.
To apply a filter to your dashboard:
Click the No filter dropdown →
In the Dashboard filter field, enter a filter expression: it will be prefixed to all queries of all widgets on the dashboard. For example, you can use filter expressions such as:
logscaleenv=prod or in(service, values=["nginx", "mysql"])This differs from aggregate functions like
groupBy()andtimeChart().Note
Dashboard filters are applied as a query prefix to the main query only and do not affect ad-hoc tables created with
defineTable(). Because ad-hoc tables run as separate subqueries, they are not affected by the dashboard filter query prefix.Click to run the filter on the running dashboard, or to save it for future use.
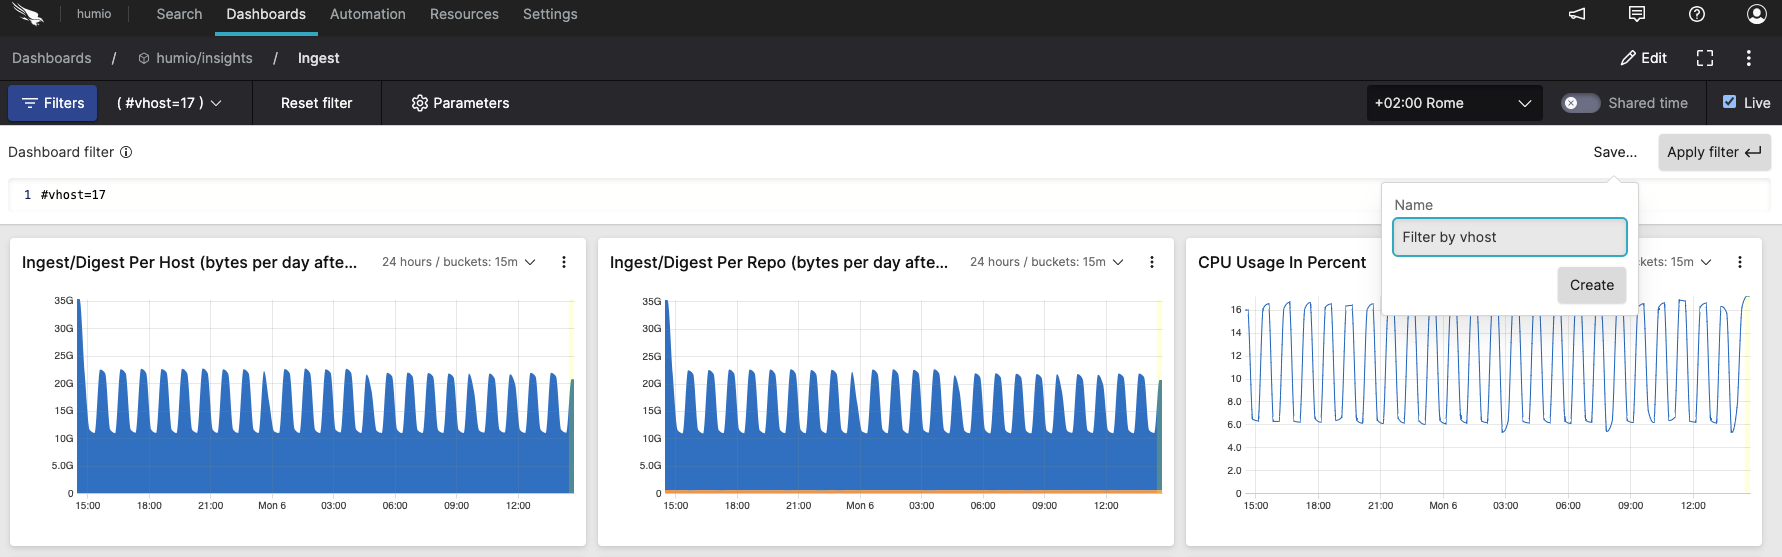 |
Figure 180. Filter configuration
To manage dashboard filters through your own custom application, you can use the GraphQL API. To add a dashboard filter, you would use the addDashboardFilter() GraphQL mutation. To change a dashboard filter, use the updateDashboardFilter() mutation. To set one as the default, use setDefaultDashboardFilter(). The removeDashboardFilter() mutation is used to delete them.