
DR Failover
This section covers the three-stage failover process: standby readiness, failover execution, and promotion to active.
Stage 1: DR Provisioning and Standby Readiness
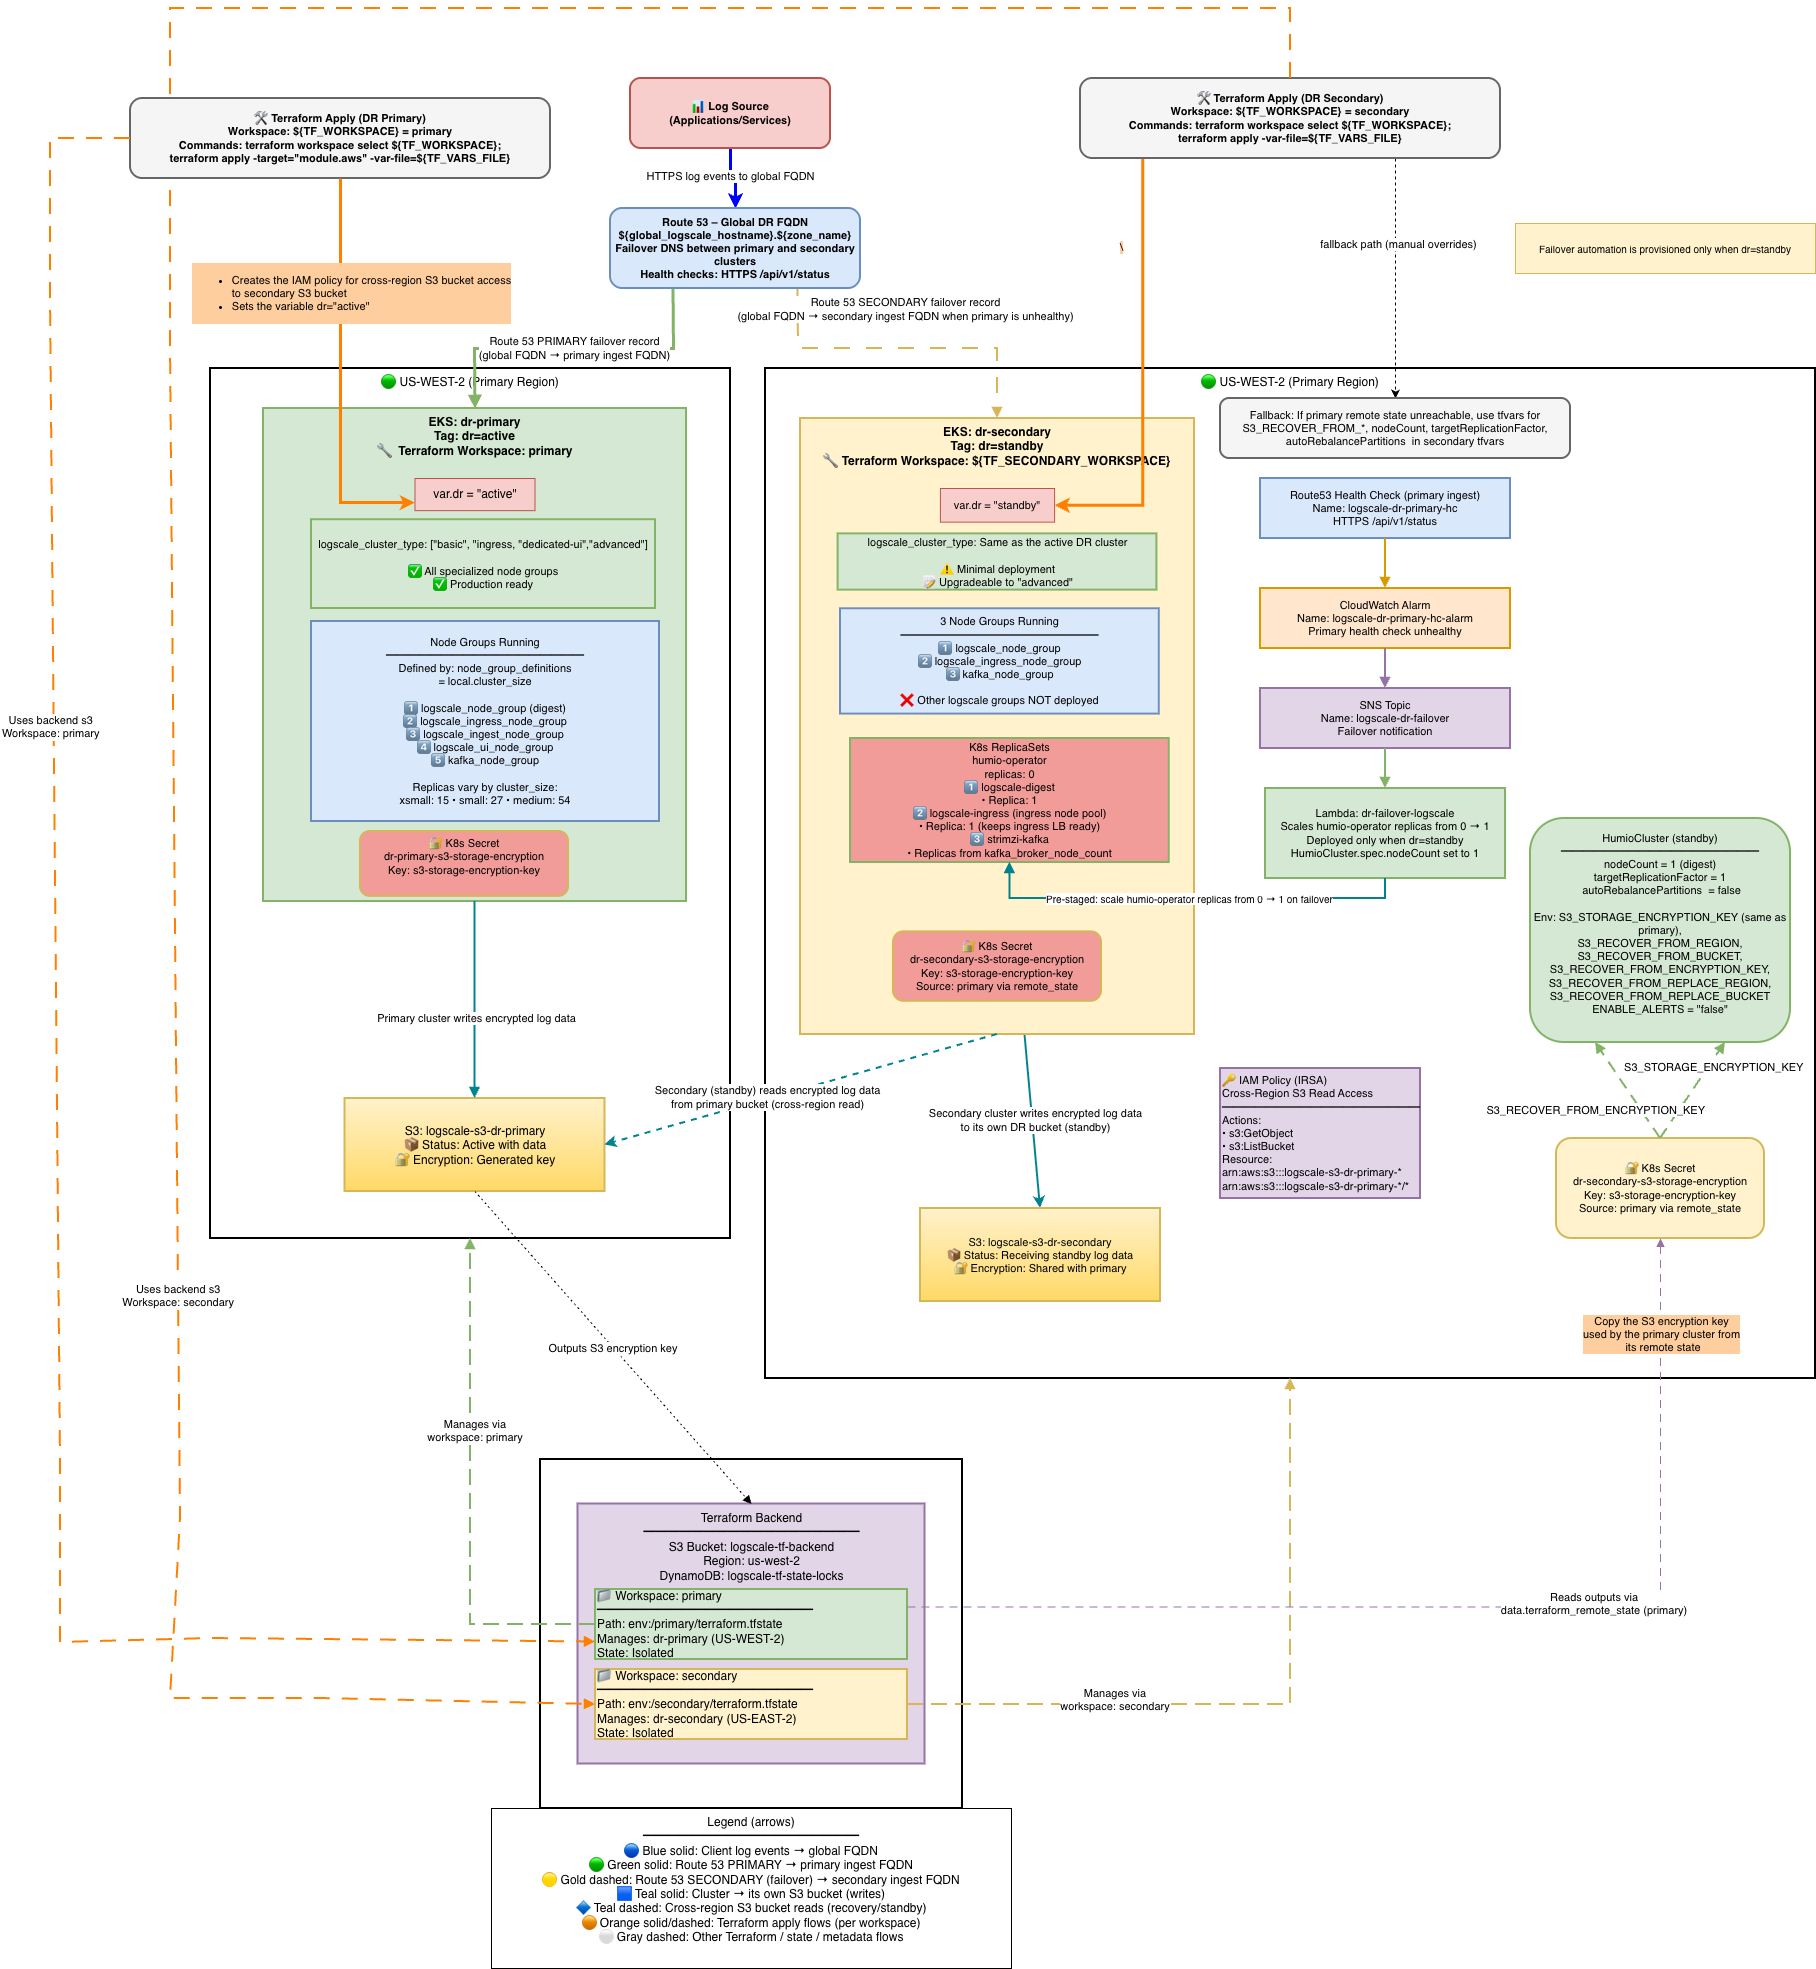
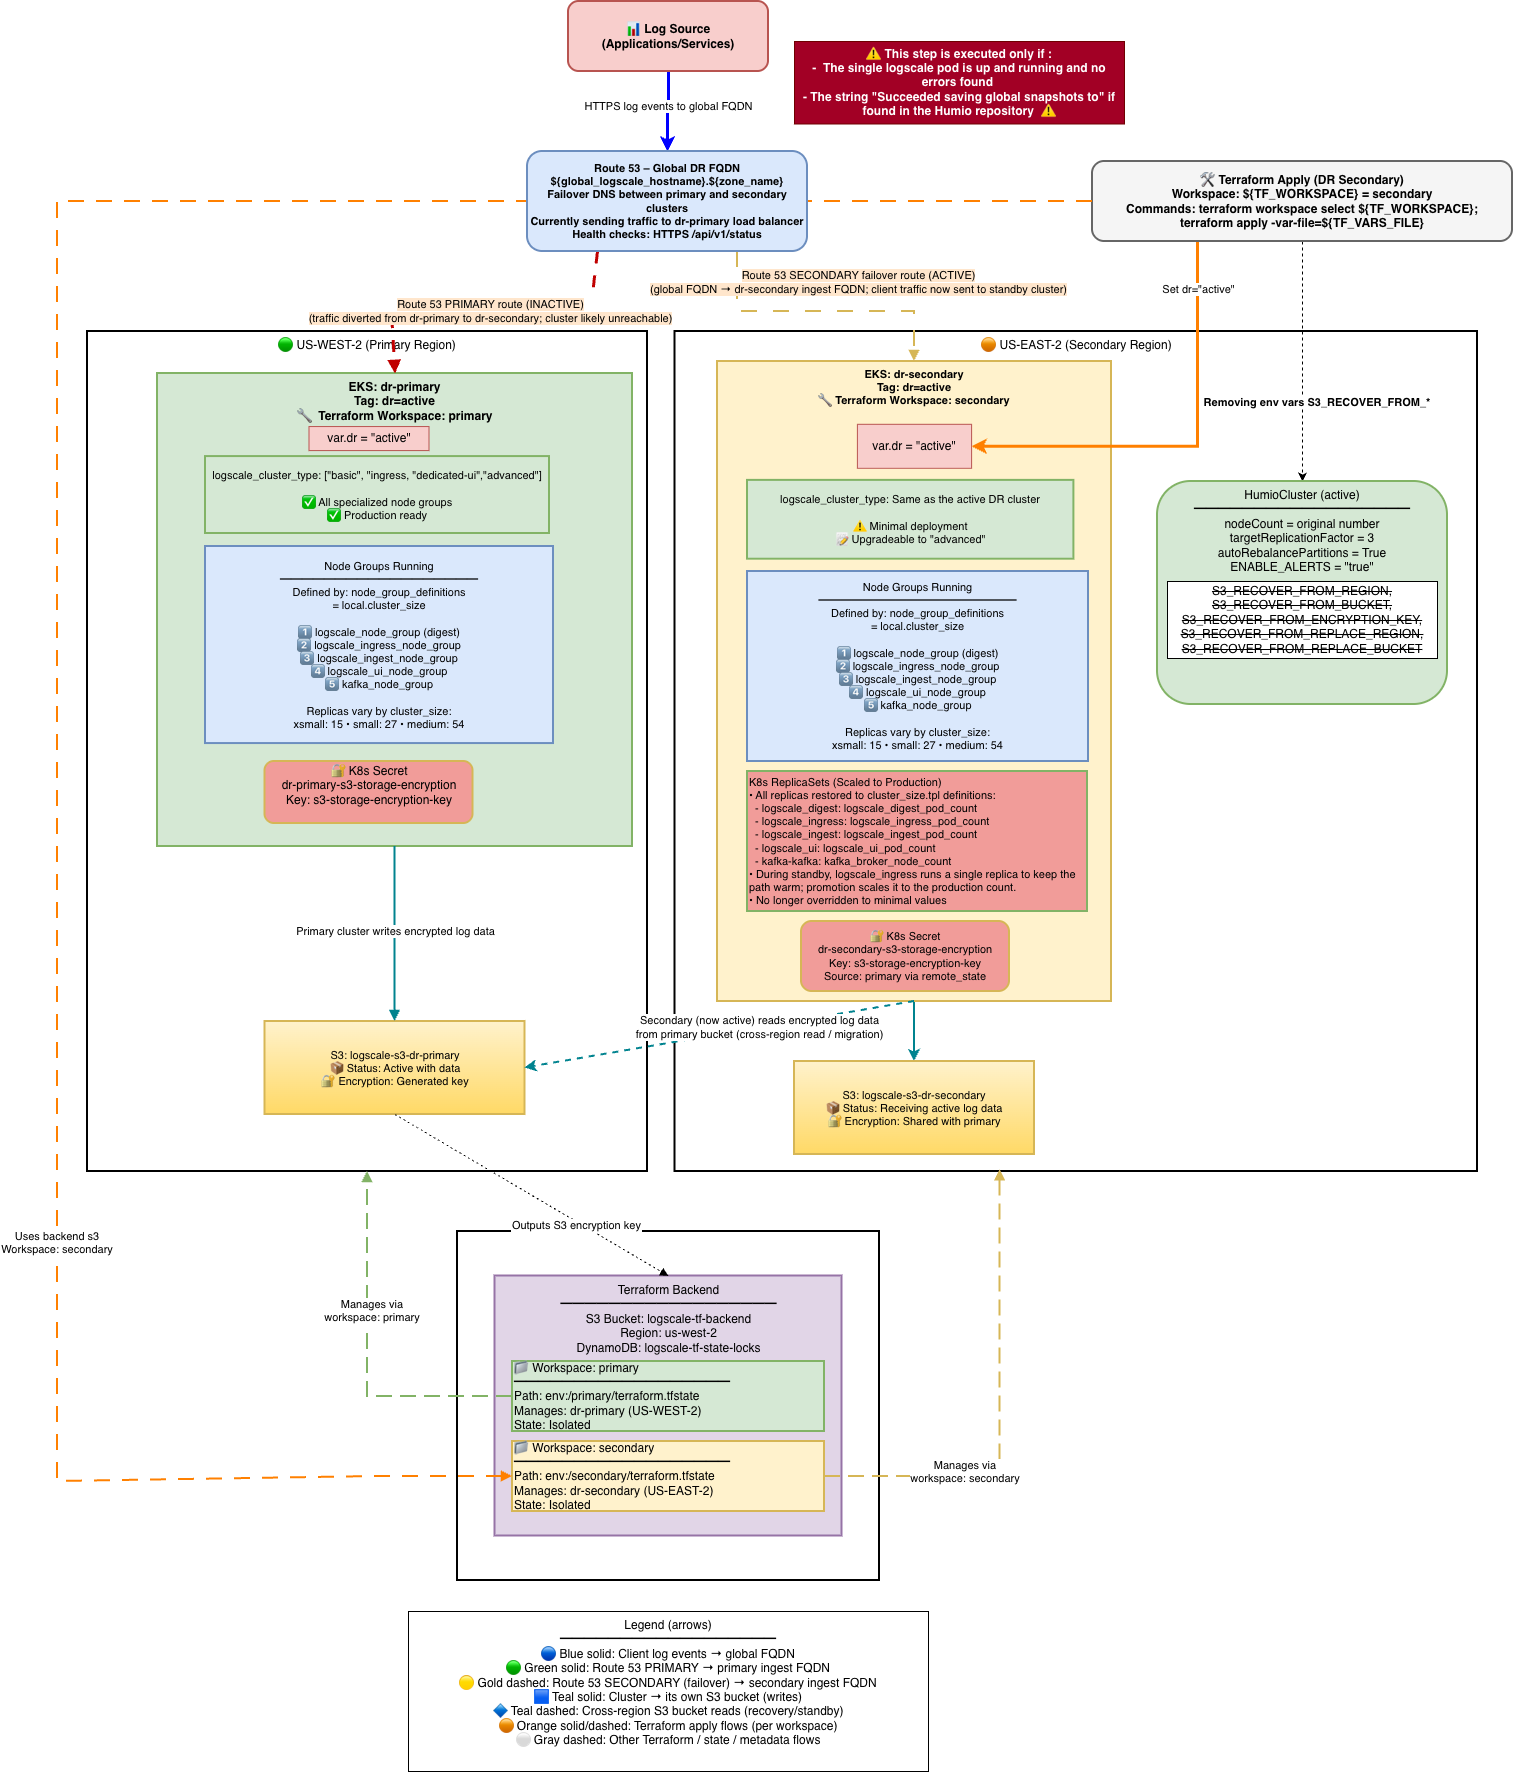
Stage 1 is the normal operational state before any disaster event. The primary cluster serves all production traffic while the secondary cluster is fully provisioned but kept idle — EKS, Kafka, and ingress are running, but LogScale pods remain at zero replicas. The Lambda function monitors the primary health check and is ready to trigger failover automatically. The diagram below shows the full architecture across both regions, including the Route53 failover routing, Terraform workspace layout, S3 bucket relationships, and the environment variables pre-configured on the standby cluster.
 |
 |
What is deployed and running:
| Component | Primary | Secondary |
|---|---|---|
| EKS cluster | Running | Running |
| Kafka brokers | Running | Running |
| LogScale pods | Full cluster_size | 0 replicas (operator off) |
| Humio operator | 1 replica | 0 replicas |
| Ingress / ALB | Active | Active (minimal) |
| Lambda | N/A | Watching primary health check |
| Route53 | Global FQDN → PRIMARY ALB | SECONDARY record (failover target) |
AWS DR Recovery Environment Variables
All variables listed in this section are set automatically by Terraform -- no manual configuration is required.
The following S3_RECOVER_FROM_* environment variables
are deployed only on the secondary (standby) cluster. They are
automatically set by Terraform when dr = "standby" - no
manual configuration is required. Their values are derived from the
primary cluster's remote state or fallback tfvars variables.
These variables tell the standby LogScale instance where to find the primary cluster's S3 bucket and how to authenticate to it. When the standby cluster is activated during failover (humio-operator scaled to 1), LogScale reads these variables at startup and performs the recovery sequence described in Secondary Readiness Required Steps.
For the complete variable reference table, source details, and Terraform resolution logic, see AWS DR Recovery Environment Variables.
Stage 2: Failover -- Scale up Humio and read global snapshot
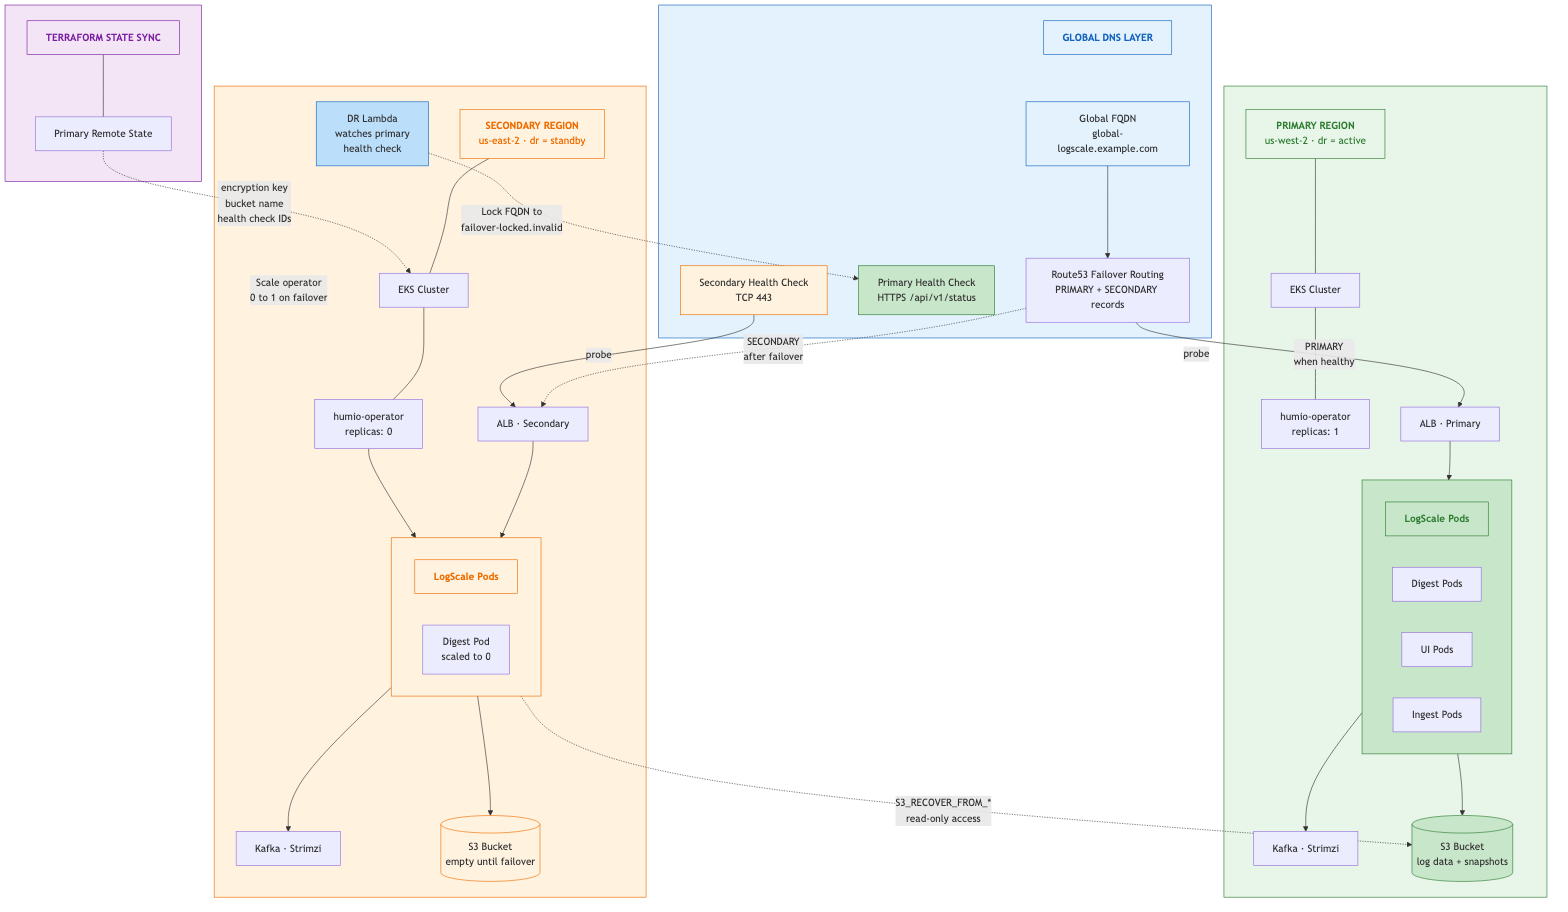
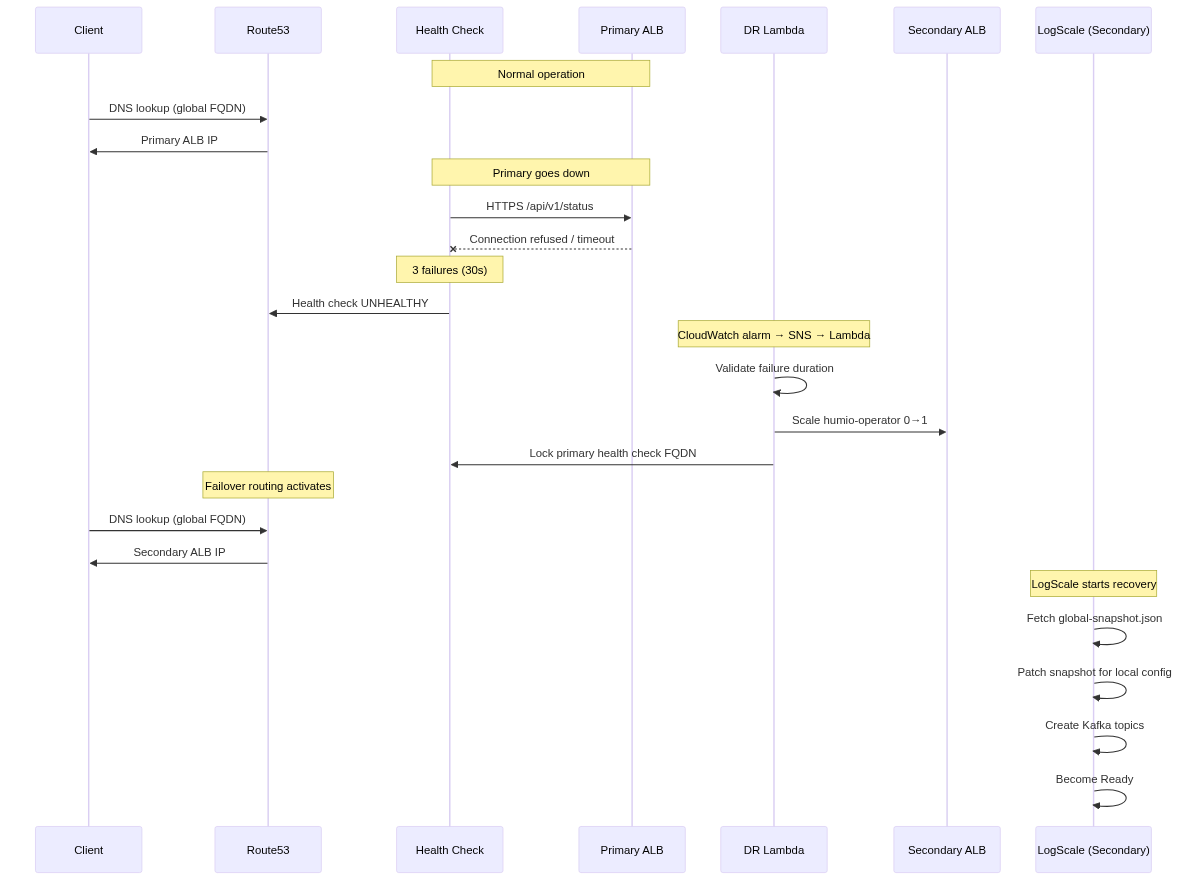
Stage 2 begins when the primary cluster becomes unreachable. The failover can be triggered automatically by the Lambda (via CloudWatch alarm and SNS) or manually by an operator. During this stage, the Humio operator is scaled from 0 to 1 on the secondary cluster, the LogScale pod starts and recovers data from the primary's S3 bucket using the global snapshot, and the primary health check FQDN is locked to prevent DNS failback. The diagram below shows the system mid-failover: the primary is down (red), Route53 has switched the global FQDN to the secondary ALB, and the secondary LogScale pod is reading from the primary's S3 bucket.
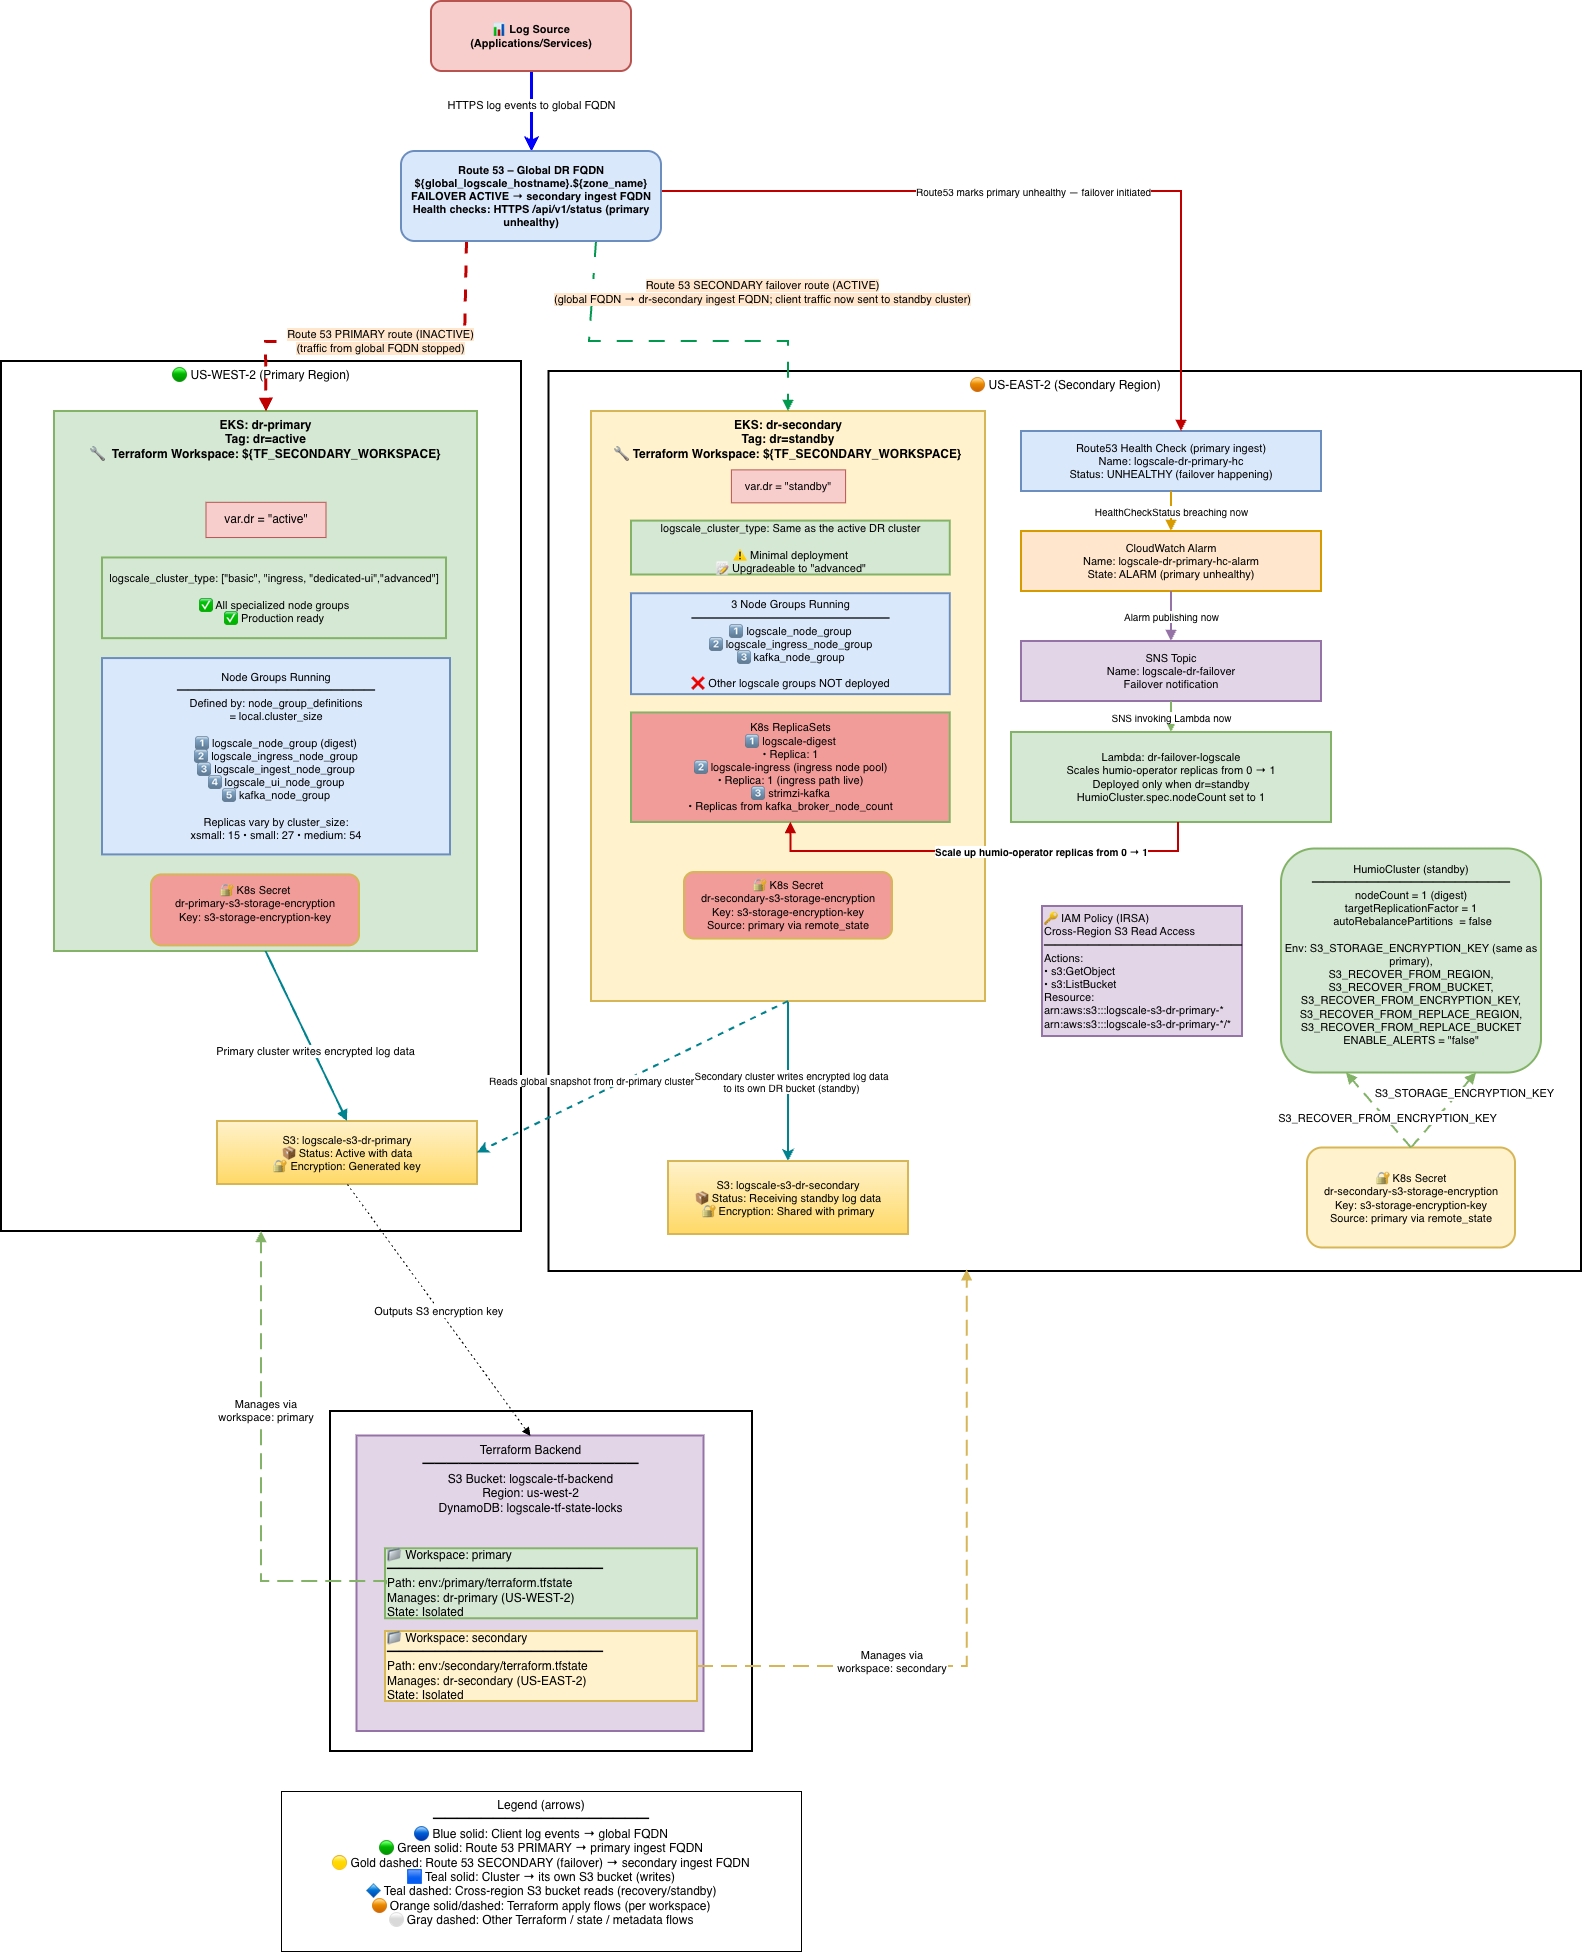 |
Stage 2 is triggered either automatically by the DR Lambda or manually by an operator.
Automatic failover (Lambda):
Primary Route53 health check fails (3 consecutive failures = 30 seconds)
CloudWatch alarm fires
SNS topic notifies the Lambda
Lambda validates the primary has been failing for at least
pre_failover_failure_seconds(default: 180s)Lambda cleans up stale TLS secrets (prevents CA mismatch)
Lambda scales humio-operator from 0 to 1
Lambda locks the primary health check by swapping its FQDN to
failover-locked.invalidto prevent automatic DNS failback
Manual failover (operator):
# Scale the operator manually
kubectl --context dr-secondary -n logging scale deploy/humio-operator --replicas=1
# Lock the primary health check to prevent automatic failback
PRIMARY\_HC\_ID=$(terraform workspace select primary && terraform output -raw primary\_health\_check\_id)
aws route53 update-health-check \
--health-check-id "$PRIMARY\_HC\_ID" \
--fully-qualified-domain-name "failover-locked.invalid"
Secondary Readiness Required Steps
On standby, the HumioCluster already declares nodeCount=1,
but the Humio operator is scaled to 0. When the Humio operator is scaled
to 1 (by the Lambda on health check failure or manually), it reconciles
the HumioCluster and starts a single LogScale pod.
Scale the Humio operator on secondary:
With Lambda enabled (default): Route53 Health Check failure → CloudWatch Alarm → SNS → Lambda scales humio-operator replicas to 1. No further action needed.
Manually (e.g., for tests or if Lambda is disabled):
shellkubectl --context dr-secondary -n logging scale deploy/humio-operator --replicas=1
Do not patch spec.nodeCount it is already set to 1.
The operator must be running for the Humio pod to start.
What Happens After Operator Starts:
The Humio operator reconciles and creates the Humio pod
The pod reads
S3_RECOVER_FROM_*env varsIt lists and downloads the latest
global-snapshot.jsonfrom the primary S3 bucketIt patches the snapshot to reference the secondary bucket/region using
S3_RECOVER_FROM_REPLACE_*valuesIt loads the patched snapshot into memory
The cluster starts up with the recovered metadata state; data segments remain in the primary bucket (read-only access)
Kafka Epoch Key and Automatic Reset:
During DR recovery, the secondary cluster connects to a different Kafka cluster than the primary. LogScale detects this via the Kafka "epoch key" (derived from the Kafka cluster ID + topic prefix) stored in the global snapshot. When the epoch key changes, LogScale requires a "Kafka reset" to proceed.
Important
Do NOT set ALLOW_KAFKA_RESET_UNTIL_TIMESTAMP_MS.
When S3_RECOVER_FROM_BUCKET is configured (as it is
on all standby clusters), LogScale automatically enables Kafka
reset. Setting ALLOW_KAFKA_RESET_UNTIL_TIMESTAMP_MS
overrides this automatic behavior due to a precedence rule in
LogScale's Config.scala -- if the env var
is set (even with an expired timestamp), the automatic
S3_RECOVER_FROM_BUCKET fallback never activates.
This can cause the pod to crash with FATAL: The Kafka epoch
key has changed if the timestamp expires before failover
occurs.
What Data is Transferred in the Global Snapshot:
The global snapshot is a JSON-based export of LogScale's internal cluster state at boot time.
Transferred in the snapshot:
Dataspaces (repositories): All repository definitions, views, retention policies, and metadata
Bucket storage configurations: Provider info (S3/GCS/Azure/OCI), regions, bucket names, encryption settings, key prefixes. During DR recovery, these are patched with new credentials and marked as readOnly=true
Segment metadata: References to log data locations including bucket IDs, byte sizes, date ranges, epoch/offset information. Only the metadata about segments is transferred, not the actual compressed log data files
Datasource configurations, license information, cluster identifiers, system configuration
Cleared during DR recovery patching:
All host entries (dropped via
dropAllHostsFromClusterForDisasterRecoveryBoot())All partition assignments (ingest, segment, and query coordination partitions deleted)
Segment ownership (
ownerHosts,currentHosts,topEpoch,topOffset)Datasource runtime state (
currentSegments,ingestEpoch,ingestOffsetcleared;ingestIdleset totrue)
NOT in the snapshot (must be synced separately):
Actual log data (compressed segments remain in primary bucket, accessed read-only by secondary)
Kubernetes Secrets: license, TLS/CA certificates, OAuth/SAML secrets, SMTP credentials, image pull secrets
Storage encryption keys (synchronized via Terraform remote state)
Runtime state: live Kafka consumer positions, query execution state, cache contents
Key insight: The global snapshot is LogScale's configuration and metadata state (~MBs), not your log data (~TBs). During DR, the secondary cluster reads the actual log events directly from the primary's S3 bucket using the segment metadata as a map.
Spot-check pods on secondary:
kubectl --context dr-secondary -n logging get pods
# Expect humio-operator (1/1), one Humio pod once recovery starts, and Kafka components running
Check recovery logs:
kubectl --context dr-secondary -n logging logs -f <humio-pod> | grep -i "recover\|snapshot\|DataSnapshotLoader"
# Should see: "Fetching global-snapshot.json from s3://..."
# Should see: "Successfully patched global-snapshot.json"
DNS Architecture and Traffic Flow
Route53 Failover Routing with Health Check FQDN Locking:
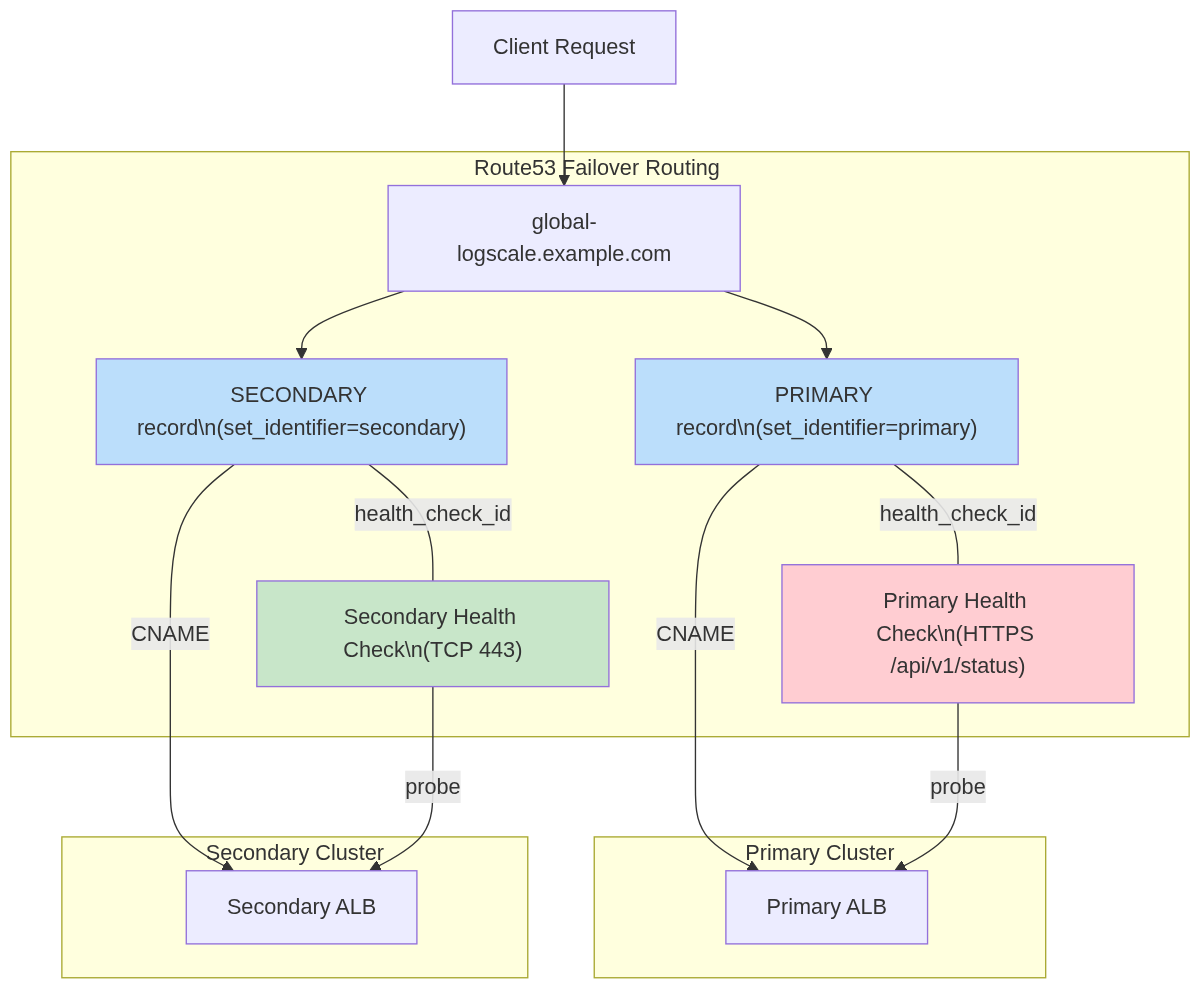 |
Automatic Failback Prevention: During failover, the Lambda swaps the
primary Route53 health check FQDN to
failover-locked.invalid, making the primary
permanently unhealthy in Route53. This prevents automatic DNS failback.
A second safeguard is lifecycle { ignore_changes } on
the health check FQDN, which prevents terraform apply from reverting the
lock.
For the full design rationale, health check state transition table, and why FQDN locking was chosen over health check inversion, see Section 18: DNS Architecture — FQDN Locking Details in the Technical Reference.
Post-Failover Verification
Important
Verify the primary health check FQDN is locked immediately after any failover.
# Primary health check should show FQDN = failover-locked.invalid
PRIMARY\_HC\_ID=$(terraform workspace select primary && terraform output -raw primary\_health\_check\_id)
aws route53 get-health-check --health-check-id "$PRIMARY\_HC\_ID" \
--query 'HealthCheck.HealthCheckConfig.FullyQualifiedDomainName'
# Should return: "failover-locked.invalid"
# If FQDN still shows the original hostname, lock it manually:
aws route53 update-health-check \
--health-check-id "$PRIMARY\_HC\_ID" \
--fully-qualified-domain-name "failover-locked.invalid"
# Secondary should be serving traffic via global FQDN
curl -sk "https://<global\_logscale\_hostname>.<zone\_name>/api/v1/status" | jq .status
# => "OK"
# DNS should resolve to secondary ALB
dig +short <global\_logscale\_hostname>.<zone\_name>
Manual Failback Procedure
Failback is never automatic. After confirming the primary is fully healthy and data-consistent:
# 1. Verify primary is fully ready
curl -sk "https://<primary\_logscale\_hostname>.<zone\_name>/api/v1/status" | jq .status
# =gt; "OK"
# 2. Restore the primary health check FQDN to the original hostname
PRIMARY\_HC\_ID=$(terraform workspace select primary && terraform output -raw primary\_health\_check\_id)
aws route53 update-health-check \
--health-check-id "$PRIMARY\_HC\_ID" \
--fully-qualified-domain-name "<primary\_logscale\_hostname>.<zone\_name>"
# 3. Verify DNS has switched back
dig +short <global\_logscale\_hostname>.<zone\_name>
# Should resolve to primary ALB
Important
Terraform includes lifecycle { ignore_changes = [fqdn,
invert_healthcheck] } on the primary health check. This means
terraform plan will not show a diff when the health check FQDN is
locked -- the FQDN swap is purely a runtime state managed by the
Lambda and operators, not by Terraform.
Warning
Do not run terraform apply on the primary state during an active
failover unless you have verified that the health check FQDN
protection is in place via lifecycle { ignore_changes
}. It is safe to run after failback when the primary is
already serving traffic.
Traffic Routing During Failover
 |
Verify DR Recovery Succeeded
After failover, verify that the secondary cluster has successfully recovered:
# 1. Check LogScale pod status
kubectl --context dr-secondary -n logging get pods -l app.kubernetes.io/name=humio
# STATUS: Running, READY: 1/1
# 2. Check recovery logs for snapshot fetch
kubectl --context dr-secondary -n logging logs <humio-pod> | grep -i "global-snapshot"
# Should show: Fetching global-snapshot.json from s3://<primary-bucket>/...
# 3. Verify LogScale API responds via global FQDN
curl -sk "https://<global\_logscale\_hostname>.<zone\_name>/api/v1/status" | jq .
# Should return: {"status": "OK", ...}
# 4. Verify DNS resolution
dig +short <global\_logscale\_hostname>.<zone\_name>
# Should resolve to secondary ALB
# 5. Check health check FQDN is locked (confirm failback is prevented)
aws route53 get-health-check --health-check-id "$PRIMARY\_HC\_ID" \
--query 'HealthCheck.HealthCheckConfig.FullyQualifiedDomainName'
# Should return: "failover-locked.invalid"
Verify via LogScale UI
Log in to the secondary LogScale cluster UI, open the Humio repository, and run the following query:
DataSnapshotLoader
| #kind != threaddumps
You should see messages similar to:
Checking bucket storage localAndHttpWereEmpty=true
Trying to fetch a global snapshot from bucket storage s3 if one exists in bucket=logscale-s3-dr-secondary-us-east-2-<account\_id>
Fetching global snapshot from bucket storage s3 found no snapshot to fetch.
Trying to fetch a global snapshot as recovery source from bucket storage in s3
Trying to fetch a global snapshot from bucket storage s3 if one exists in bucket=logscale-s3-dr-primary-us-west-2-<account\_id>
Fetched global snapshot from bucket storage s3 found snapshot with epochOffset={epoch=0 offset=699094}
Fetched a global snapshot as recovery source from bucket storage in s3 and got snapshot with epochOffset={epoch=0 offset=699094} now patching...
Snapshots to choose from, last is better...: List(({epoch=0 offset=699094},s3)) using kafkaMinOffsetOpt of Some(KafkaMinOffset(...))
Selecting snapshot from source=s3 with epochOffset={epoch=0 offset=699094}
updateSnapshotForDisasterRecovery: Patching region using from=us-west-2 to=us-east-2 on bucketId=1
updateSnapshotForDisasterRecovery: Patching bucket using from=logscale-s3-dr-primary-us-west-2-<account\_id> to=logscale-s3-dr-secondary-us-east-2-<account\_id> on bucketId=1
updateSnapshotForDisasterRecovery: Patching access configs from RECOVER\_FROM on bucketId=1
updateSnapshotForDisasterRecovery: setting readOnly=true on bucketId=1 keyPrefix= new value for bucket=logscale-s3-dr-secondary-us-east-2-<account\_id>
Real LogScale logs showing successful DR standby synchronization:
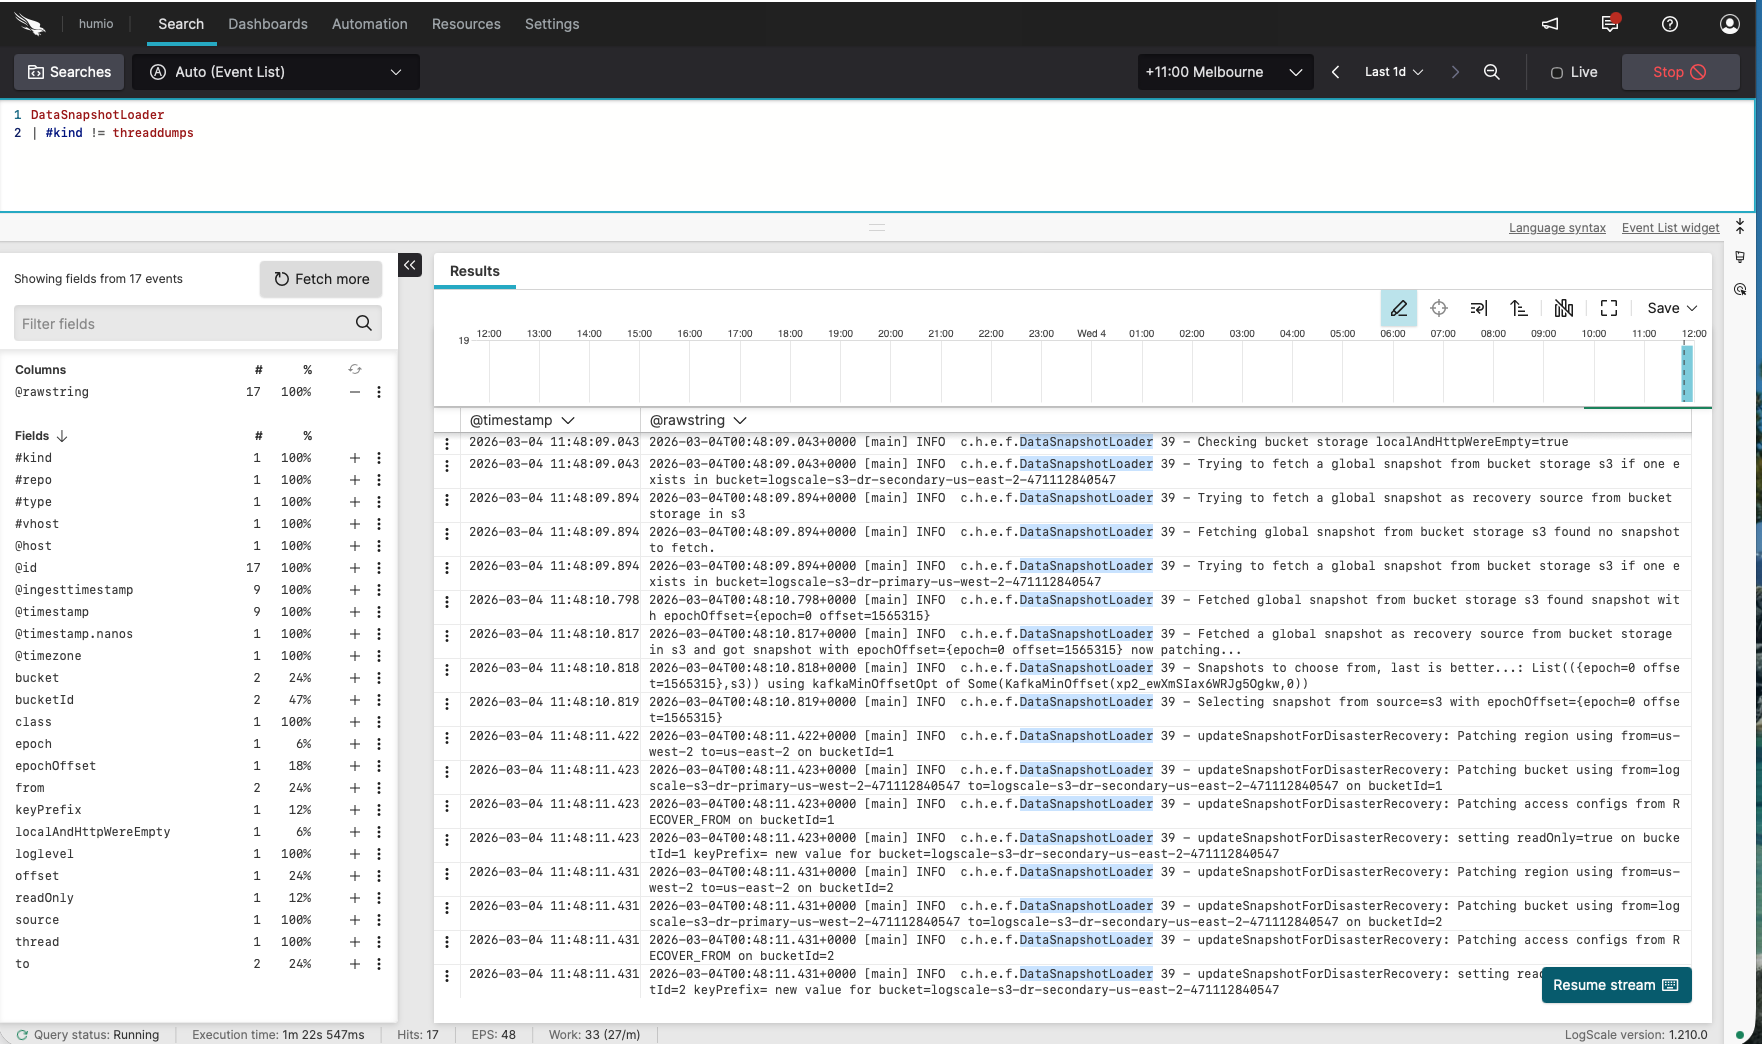 |
Note: The logs show:
First checks the secondary bucket (
logscale-s3-dr-secondary-...) - finds no snapshotThen fetches from the primary bucket (
logscale-s3-dr-primary-...) as the recovery sourcePatches the snapshot to use the secondary bucket for new writes
Sets the primary bucket reference to
readOnly=true
Ready to promote when:
Operator is 1/1 on secondary
Kafka components exist on secondary
DataSnapshotLoader logs match the expected sequence above
Snapshot file shows patched region/bucket pointing to secondary; encryption keys match
Stage 3: Promote Secondary to Active
Stage 3 converts the secondary cluster from a minimal failover state into
a full production cluster. This involves changing dr
from "standby" to "active" and running a two-phase Terraform apply. The
cluster scales up to full capacity (additional node groups, production
replica counts, alerting enabled), and the DR Lambda and its associated
resources are removed since they are no longer needed. The diagram below
shows the final promoted state: the secondary is now the active cluster at
full scale, the primary remains down with its health check locked, and all
traffic flows through the promoted cluster.
 |
Once the secondary cluster is verified and serving traffic, you may want
to promote it to a full active cluster. This involves changing
dr from "standby" to "active" and applying Terraform.
What promotion changes:
| Setting | Before (dr="standby") | After (dr="active") |
|---|---|---|
| Humio operator replicas | 0 (or 1 if failover happened) | 1 |
| HumioCluster nodeCount | 1 | cluster_size digest count |
| Additional node groups | None (no UI/Ingest) | UI, Ingest node groups created |
| Replication factor | 1 | Production value |
| ENABLE_ALERTS | false | true |
| DR Lambda | Deployed | Removed |
Zero-Downtime Promotion (Two-Phase Apply)
For zero-downtime DR promotion, use the two-phase terraform apply
approach with the dr_use_dedicated_routing variable.
This ensures traffic continues to flow to the existing digest pod while
UI/Ingest pods scale up.
Understanding dr_use_dedicated_routing:
dr_use_dedicated_routing = true(default): Services look for specific pod types. The UI service only routes to UI pods, and the ingest service only routes to ingest pods.dr_use_dedicated_routing = false: Services look for ANY LogScale pod, regardless of type.
Why two phases are needed:
When promoting from dr="standby" to
dr="active", the HumioCluster's node pool configuration
changes from digest-only (1 pod) to the full production topology (digest
+ UI + ingest pods). Without two phases:
Service selectors immediately change to look for UI pods (
humio.com/node-pool=<prefix>-ui)UI pods don't exist yet
Services have zero endpoints → 503 errors
With two phases:
Phase 1: Selectors use
app.kubernetes.io/name=humioto match ALL LogScale pods (including existing digest pod)Traffic continues to existing digest pod during UI/Ingest scale-up
Phase 2: After UI/Ingest pods are ready, selectors switch to pool-specific routing
dr_use_dedicated_routing Behavior Matrix:
| dr | dr_use_dedicated_routing | Selector Used | Use Case |
|---|---|---|---|
| "active" | false | Generic (app.kubernetes.io/name=humio) | Phase 1 of promotion - zero downtime |
| "active" | true | Pool-specific | Phase 2 of promotion / normal production routing |
| "standby" | false | Generic (app.kubernetes.io/name=humio) | Standby waiting for failover |
| "standby" | true | Pool-specific | Standby with dedicated routing (rare) |
Phase 1: Promote with Generic Selectors (Zero-Downtime)
# Edit tfvars for Phase 1
vi secondary-us-east-2.tfvars
dr = "active"
dr\_use\_dedicated\_routing = false # Generic selector - matches ALL pods
# Apply Phase 1
terraform workspace select secondary
terraform apply -var-file=secondary-us-east-2.tfvars
# Verify UI and Ingest pods are coming up
kubectl --context dr-secondary -n logging get pods -l humio.com/node-pool
# Wait until UI and Ingest pods show Running and Ready
Phase 2: Enable Dedicated Routing (After Pods Ready)
# Option A: Stay in DR mode with optimal routing
vi secondary-us-east-2.tfvars
dr = "active"
dr\_use\_dedicated\_routing = true # Pool-specific selectors - optimal routing
# Apply Phase 2
terraform workspace select secondary
terraform apply -var-file=secondary-us-east-2.tfvars
# Verify services have correct endpoints
kubectl --context dr-secondary -n logging get endpoints
Standard Promotion (Single Apply)
If downtime during promotion is acceptable:
vi secondary-us-east-2.tfvars
dr = "active"
# dr\_use\_dedicated\_routing defaults to true
terraform workspace select secondary
terraform apply -var-file=secondary-us-east-2.tfvars
What changes automatically on promotion:
Scales node groups to production sizes
Sets production replication factor and enables auto-rebalance
Enables alerts by setting
ENABLE_ALERTS=trueHumio operator scales to 1 and HumioCluster
nodeCountfollows production values
Resources destroyed during promotion
When promoting from dr="standby" to
dr="active", Terraform destroys the entire
module.dr-failover-lambda because automated failover
is no longer needed. The following resources are removed:
Lambda Function (
<cluster>-dr-failover-handler) — the automated failover functionCloudWatch Alarm (
<cluster>-dr-failover-primary-unhealthy) — the Route53 health check monitorSNS Topic + Subscription (
<cluster>-dr-failover-sns) — the cross-region alarm-to-Lambda bridgeLambda IAM Role + Policy — the role and inline policy granting EKS, Route53, CloudWatch, KMS, and SSM access
EKS Access Entry — Lambda's cluster access entry (namespace-scoped to logging)
KMS Key — the KMS key used to encrypt Lambda environment variables
CloudWatch Log Group (/aws/lambda/<cluster>-dr-failover-handler) — Lambda execution logs
Global DNS note: Promoting the standby to dr="active" does
not automatically move ownership of the Route53 global DNS resources.
Keep manage_global_dns=true only in a single workspace to
avoid two states managing the same failover records/zone.
S3_RECOVER_FROM_* Environment Variable Preservation
When promoting dr="standby" to dr="active",
Terraform removes the S3_RECOVER_FROM_* environment
variables from the HumioCluster manifest. This is intentional:
During standby: These variables tell LogScale where to fetch recovery data (primary's S3 bucket)
After promotion: The cluster is fully independent and writes to its own S3 bucket; recovery variables are no longer needed
If data migration is still in progress: Keep dr="standby" until LogScale has finished copying all segments from the source bucket to its own bucket. Monitor the DataSegmentUploader logs
Operational implication: Removing these env vars changes the HumioCluster spec and may cause the operator to roll/recreate pods during promotion. Plan for a restart window as part of the promotion process.
Verify promotion:
# Confirm S3\_RECOVER\_FROM\_\* env vars are removed
kubectl get humiocluster -n logging --context dr-secondary -o yaml | grep S3\_RECOVER
# Should return empty
# Verify nodeCount is at production value
kubectl get humiocluster -n logging --context dr-secondary -o jsonpath='{.items[0].spec.nodeCount}'
# => production value (e.g., 3)
# All pods running
kubectl get pods -n logging --context dr-secondary
# => all pods Running
Failover Timing Summary
Important
The timing values in this section were measured on a new test cluster with very low ingestion volume. Production clusters with higher data volumes, larger node counts, and bigger snapshots will likely experience longer recovery times. Use these figures as a baseline reference, not as guarantees.
End-to-End Failover Timeline
Total failover time depends on three phases: detection, Lambda execution, and LogScale recovery.
Detection phase:
| Component | Duration | Notes |
|---|---|---|
| Route53 health check failure | ~30s | 3 failures at 10s interval |
| CloudWatch alarm evaluation | ~60s | 1 evaluation period |
| Pre-failover validation | 0-180s | Configurable (default 180s) |
Execution phase:
| Component | Duration | Notes |
|---|---|---|
| SNS → Lambda invocation | <1s | Near-instant |
| Validate health check + clean TLS secrets | ~4s | Route53 + Kubernetes API calls |
| Scale operator 0 → 1 | ~3s | Kubernetes API call with retry |
| Lock primary health check FQDN | ~1s | Route53 API call |
Recovery phase:
| Components | Duration | Notes |
|---|---|---|
| Operator starts LogScale pod | ~30-60s | Pod scheduling and image pull |
| Snapshot fetch and patch | ~30-120s | Depends on snapshot size and S3 latency |
| Kafka topic creation + LogScale ready | ~60-120s | Full initialization |
| Route53 DNS propagation | ~60s | TTL-dependent (default 60s) |
Total expected time:
| Scenario | Detection | Lambda | Recovery + DNS | Total |
|---|---|---|---|---|
| Production (180s validation) | ~90s | ~188s | ~3-6 min | ~7-10 min |
| Testing (0s validation) | ~90s | ~8s | ~3-6 min | ~5-8 min |
Configuration Variables
| Variable | Default | Testing | Description |
|---|---|---|---|
dr_failover_lambda_pre_failover_failure_seconds
| 180 | 0 | Minimum consecutive failure seconds before triggering |
route53_record_ttl
| (required) | 60 | DNS record TTL in seconds |
| Health check interval (primary / secondary) | 10s / 30s | Hardcoded | HTTPS probe for primary, TCP for secondary |
| Failure threshold (primary / secondary) | 3 / 2 | Hardcoded | Consecutive failures before marking unhealthy |
Pre-failover holdoff: The Lambda queries CloudWatch to verify the primary
has been continuously failing for at least
pre_failover_failure_seconds before proceeding. If
insufficient time has passed, the Lambda exits without action and
CloudWatch re-invokes on the next alarm cycle. Set to 0 for testing only
— always use the default 180 in production to prevent false
failovers.
Cooldown: The Lambda records its last failover timestamp to SSM Parameter
Store
(/logscale-dr/<function-name>/last-failover-timestamp)
and skips execution if within the cooldown period (module-internal
default: 300s, not configurable via tfvars). The SSM persistence ensures
the cooldown survives Lambda cold starts and redeployments.
Testing vs Production
# Fast failover for testing (NOT for production)
dr_failover_lambda_pre_failover_failure_seconds = 0
# Testing timeline: ~5-8 minutes

# Production defaults (prevent false failovers)
dr_failover_lambda_pre_failover_failure_seconds = 180
# Production timeline: ~7-10 minutes
Cross-Cloud Timing Comparison
| Phase | AWS (Route53) | Azure (Traffic Manager) | OCI (DNS Steering) |
|---|---|---|---|
| Health check interval | 10s | 30s | 60s |
| Failure threshold | 3 failures | 3 failures | N/A (alarm-based) |
| Detection time | ~30s | ~90s | ~55s |
| Function execution | Lambda ~8s | Azure Function ~10-20s | OCI Function ~49s |
| DNS propagation | ~60s (TTL) | ~60s (TTL) | ~60s (TTL) |
| Failback prevention |
FQDN locked to failover-locked.invalid
| Primary endpoint disabled | Steering policy answer disabled |
DR Promotion Scaling Timeline
Expected phases when promoting from dr="standby" to
dr="active". Values are estimated — measured on a test
cluster with minimal ingestion.
Phase 1:
| Action | Estimated Duration |
|---|---|
terraform apply (set dr="active",
dr_use_dedicated_routing=false)
| 2-5 min |
| EKS UI/Ingest node groups provision (EC2 instances boot) | 3-6 min |
| Pod scheduling + readiness | 3-7 min |
Phase 2:
| Action | Estimated Duration |
|---|---|
terraform apply (set dr_use_dedicated_routing=true)
| 1-2 min |
| Ingress reload + endpoint update | 30-60s |
| DNS propagation (if applicable) | 60-180s |
Total: ~10 - 20 minutes
Verification:
# Check all pods running after Phase 1
kubectl get pods -n logging --context dr-secondary
# Verify UI/Ingest nodes
kubectl get nodes --context dr-secondary -l purpose=logscale-ui
kubectl get nodes --context dr-secondary -l purpose=logscale-ingest
# Check ingress routing after Phase 2
kubectl get ingress -n logging --context dr-secondary -o yaml | grep -A 5 "rules:"